Thursday, February 13, 2014

Thursday Morning East Coast Snow Update

Heavy snow continues to fall from Washington, DC to Boston
NORTH EAST RADAR LOOP HERE


Updated Flight cancellations HERE

Snowfall amounts by early Friday morning will be extremely heavy.


Pennsylvania Avenue traffic cam. Click on the image for the most recent image.
http://pub2.camera.trafficland.com/image/live.jpg?system=ddot&webid=200151&size=full&pubtoken=564535662a6d4a5f33ba96cd310d8b57&t=1392294018848


Wednesday, February 12, 2014

Update on Southern Ice Storm; East Coast Snow

This is just beginning...Current southeast radar image. LOOP HERE


All National Weather Service offices have special statements and graphics regarding the ice accumulation and heavy snow from Atlanta to Boston. NWS amounts below:


SPIA Ice Index VERY HIGH:


Snowfall for the Carolinas


Snowfall for Baltimore/Washington, DC


Snowfall for New Jersey/Philadelphia:


Snowfall for New York City Metro Area


Snowfall for New England


Tuesday, February 11, 2014

Historic Ice Storm For Deep South, Heavy Snow for East Coast

Southern storm tracks are becoming more common over the last several weeks. This means gulf moisture interacts with very active storms which develop over Texas and trek east dragging cold air into areas that are not accustomed to seeing ice and snow accumulations like what will soon fall over the next 48 hours.

Current southeast radar image. LOOP HERE

The NWS in Atlanta issued this statement and graphic on the ice storm:

Snowfall totals will be significant across the Carolinas and Mid Atlantic through early Thursday.


Same goes for the northeast through Friday early afternoon.

NWS Boston statement and snowfall graphic:


Thursday, February 06, 2014

This Week's Snow Totals vs Various Model Outputs

How many people continue to believe Facebook and Twitter posts showing model output images of snow storm amounts more than 5 days before it happens? Too many. 

Last week, I wrote why this a BIG mistake. Computer model outputs are to be used as guidance NOT Gospel.  The general public see these posts and treat these maps as actual forecasts by Meteorologists.  They spread like wildfire on social networks causing hype and in some cases paranoia! I lost track how many times I was asked directly "When is this huge snow storm coming? 20 inches in one day?" It wasn't IF the snow was coming but WHEN.

I saved several different model depictions of this "potential snow storm 6 and 7 days BEFOREHAND. Notice how dramatically the snow amounts changed from one day to another.

EUROPEAN DETERMINISTIC
Even the short term, higher resolution model within 24 hours of the event showed HUGE variation.


The FINAL totals...


Once again, trust the HUMAN not the COMPUTER OUTPUT!

Tuesday, February 04, 2014

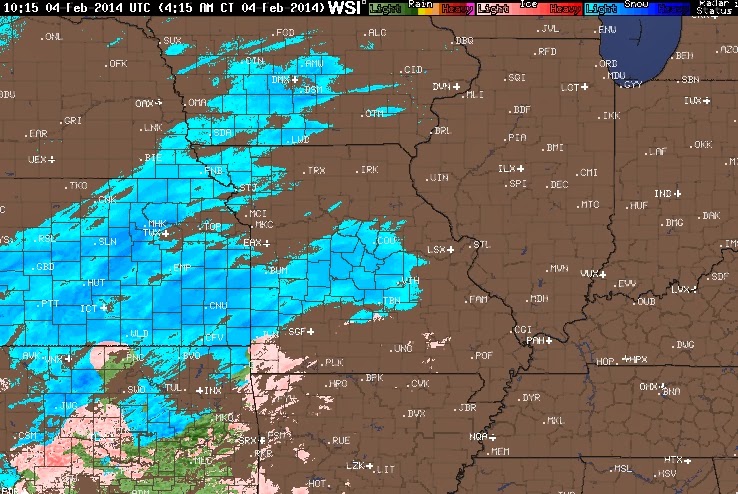
Tuesday Morning: Heavy Snow UPDATE

Widespread snow event is still on track.


Snow spreading into Missouri as of early Tuesday morning.

RADAR LOOP HERE OR CLICK ON THE IMAGE BELOW

http://www.intellicast.com/National/Radar/Current.aspx?location=USMO0453&animate=true

Scattered light snow later this afternoon won't affect the evening commute much. The bulk of the snow arrives this evening.
The storm looks to take a more southerly track which would keep temperatures below freezing limiting the transition to sleet and keeping the precipitation mainly snow.


 Ohio temperatures stay below freezing all night.

Updated snowfall forecast is as follows: Most areas will receive between 6 and 10 inches of snow by noon Wednesday.

Monday, February 03, 2014

Heavy Snow for Ohio Valley/Northern Ohio

Last week I wrote about why I believe its a risk to post snowfall forecasts online 5 to 7 days out because of the inherent changes in snowfall forecasts and the nature of computer models. Now that we are within 2 days of the event, some educated projections based on the higher resolution, shorter term computer projections mixed with some past experiences are more realistic.

The panhandle of Texas is very quiet as of Monday morning...

Seasonal snow last 40 years through February 2nd. This year is now 10th...probably 7th by week's end.


CLICK HERE FOR THE TEXAS RADAR  for the development of the rain and snow later today and tonight.


The 32 degree line will lift north tomorrow night. The position will be critical for a brief transition to a SLEETIER SNOW south compared to the heavier wetter snow north. A difference of 10-15 miles north or south of the path of the low will make a HUGE difference. I'll update this later today.


Based on the track of the low, the depth of the "milder air" ahead of the low along with the depth of the moisture and the upper level conditions, our updated snowfall forecast is as follows. The high resolution shorter term NAM model has a good handle on the snow as of noon Monday. ...updates later today on FOX8 with Andre and Melissa.


Friday, January 31, 2014

Don't Believe Snowfall Forecasts A Week Out


This pattern gets very tricky with a slightly southerly flow (WSW to ENW) this weekend and especially over the next week. The probability for more "panhandle snows" is growing.


In this age of the internet where every possible computer model and projection is available 24/7 on hundreds of websites and apps, anyone can post snapshots of these computer outputs especially when a rumor of heavy snow gains steam (next week). The problem with this is twofold. First, most people believe that these neat looking maps mean more accurate forecasts especially farther out.  Secondly, most people treat these snapshots as Gospel and believe that these computer model depictions are actual forecasts. Nothing could be further from the truth. The phrases "could happen" with "mostly likely" to happen become interchangeable. Both phrases couldn't be more different. Wxbrad has an excellent post on this here.

"Could happen" scenarios bubble up from the seeds nestled in a common computer model misconception. Many believe that they provide forecasts. Not true. They are only guides. Nothing more. They come in two forms or outputs. One is called a deterministic solution, the other is an ensemble. A deterministic is ONLY ONE possible outcome with a set of initial conditions. An ensemble is a blend or average of a bunch of deterministic solutions. It smooths out the extremes giving us an average of the multiple outputs. The problem lies within the INITIAL CONDITIONS. Not all weather conditions are known for each geographic point in an area (in this case, northern Ohio). So there are data gaps before the model even runs. So unless you know the weather conditions for each and every point in northern Ohio (say every 50 or 100 feet) the computer output will have gaps. The overall solution will be estimated and smoothed out where these gaps exist.  Imagine the gaps between Cleveland and Westlake or Akron and Medina. Actual solutions for these gaps are not known so the output is approximated.

We learn to use both the ensemble and deterministic in our assessment of each weather pattern and forecast for the area. Computer models are only a guide, an interpretation of the weather scenario, nothing more. We learn the pros, cons and biases inherent in each model and apply them to the current weather situation. Meteorologists deal in "mostly likely" scenarios after taking all of the available data and computer models into account.  WE create forecasts that are "mostly likely" to occur. Look how the computer output (GFS) for snowfall accumulation for next week has changed in both depth and location over the last 3 days.


Be careful of Facebook posts that show solutions more than 5 days out. This is only one possible solution with one set of initial conditions showing a "could happen" scenario. Don't get me wrong. Its fun to speculate. But "Could happen" scenarios are not a healthy way of looking at the weather (just look at the devolution of Facebook comment threads). "Mostly likely" scenarios are safer and work better in the long run.

Trust the meteorologist not the computer.

Thursday, January 30, 2014

Behaviorial Meteorology: Psychology Behind Our Cold Weather Perceptions


Last year I wrote an article on how our perceptions of the weather are shaped by events that have
occurred most recently. This winter's cold weather is a prime example: The last two winters have
been milder in comparison so we are preconditioned to believe that this winter would not only be
worse (which it is) but one of the worse in years and comparable to the harsh winter of the 1970s and
early 1980s. Both are false.
 
Why do we perceive this winter to be one of the worst ever? Its a classic example of the RECENCY
EFFECT: This is the tendency to think that more recent trends and patterns we observe (which are
more recent in our minds like our recent mild winters) are a very good representation of the
entire period in question. Since the winters of yesteryear are distant memories, we tend to weight
them less than our memories of recent winters. We believe our memories and observations--
recent mild winters--are excellent predictors of what the near future will bring.


How often has someone said to you this past fall "We are due for a bad winter".  Or how about
this: "This winter has to be one of the coldest ever" or "This colder trend recently surely means
that the rest of the spring and summer will be cold?  That is the RECENCY EFFECT at work.
Those frequently uttered sentences above are totally driven by our perceptions.  Our perceptions
make us feel good because they fit our hard-wired biases.  Most of the time, we grossly
underestimate the significance of our biases. The truth is that this winter is ranked...45th coldest! 
The winter pattern rarely has a connection to spring or summer. Hard to believe but its true.

This type of information might run counter to our perceived notions ultimately becoming a source of
frustration and internal conflict.  We have a built in motivation to reduce conflicting ideas by altering the existing conditions in our mind to create consistency. Pick any topic: weather, economics, politics, investing...anything. We all do it. 
In the case of understanding our winter weather or any weather during any season), we do this by 1)  Believing weather information which best fits our preconceived notions 2)  We alter its importance in our mind and/or dismiss the hard, cold facts and data all together or 3) We just plain criticize it. Sometimes, it’s a blend of all three. This inclination to favor information that reinforces our comfort level is called a "Confirmation Bias".  Incidentally, this happens all of the time inside Facebook comment threads.

Watch what happens when the first cold stretch develops in spring. Everyone will be shouting that
"they knew this would happen because of our cold winter." That's classic CONFIRMATION BIAS.
The problem is that as we create "consistency" through favoring our own view of the information,
we create a new false interpretation of the weather which we believe to be true. Rather than
looking objectively at the reasons for the change scientifically (science scares people), most
people tend to use an overly simplified and often inaccurate scientific explanation of the weather
to ultimately confirm their predispositions.

The response "We are due for a bad winter" has virtually no scientific merit.  For events that require object analysis, our own human nature deceives us.  In this case, our biases "cloud"--no pun intended--our judgment of the weather.  By recognizing our own weather biases, we can actively attempt to dampen the effects. As much as it might hurt, trust the data.

Wednesday, January 29, 2014

Northern Ohio Winter Weather Scorecard


We were spoiled over the last 2 winters with little snow and frequent breaks in the cold. This winter has been more typical of winters past: Long stretches of cold, a deep snow cover with periods of extreme cold. How does this winter compare with recent winters? Last 30 winters?

We all perceive the winter to be a certain way depending on how much weight each of us puts on the different parameters. Some use snowfall as the definitive measure of the winter's weather. Others look at the extreme cold (nights below zero) as a better measure. We will look at several winter parameters to determine how they all rank across the board.

1) The average temperature since December 1st:

  4 winters since 2000 were far colder OVERALL! How would you rank this winter so far?... Coldest in years? Do you think it's in the top 10? 
This winter ranks...45TH ALL-TIME!

The average temperatures for the month of January:

This month was far colder...coldest in 5 years YET only 29th coldest all-time!
How about snowfall:  44.9" through the 29th of January with more wet snow to come.

This is the most since 2008-09. Yet we've had 7 winter since the early 1990s with MORE SNOW through the end of January.

Lake Erie ice cover has increased to well above 95% after the most recent arctic outbreak.  
 This is the most since 2011 when we had 97.6%. The years with more ice cover as of January 29th:  2011, 2003, 1997, 1994, 1986, 1982, 1978, 1977


We tend to recall the extremes of a season not the averages. So how to the extremes rank? Here are the number of days in the single digits. 
This year has had the most single digit temperatures since 1994
This year's 27 days at or below freezing is comparable to other colder winters since the early 1980s 

Many, many days with snow on the ground make the winter seem a lot worse. We have 43 days so far. The way we are going, this year will finish out as having the most days with at least an inch of snow since the late 1970s.
15 more days with at least of snow on the ground will break the ALL-TIME record of 57 days!

There's a lot of information here. What we need to take home from all of this winter data is this:   

The winter is no where near the coldest overall (45th coldest). Here is where the psychology comes into play: When evaluating how cold the winter has been thus far, we remember the extremes in both temperature (most in 20 years) and days with snow on the ground (close to the all-time record) not the averages.

Monday, January 27, 2014

Snow Rollers


Lots of people asking what these "snowballs' are rolling around in the backyard. These are called Snow Rollers. They occur when the temperatures are just warm enough (slightly above freezing) so that the snow melts just enough to stick together. The winds have to be at just the right direction and speed (usually light) for the snow to roll and coalesce without falling apart.

Here are a few pictures from Lexington and Medina, Ohio


More snow rollers. This one from Garrettsville, Ohio

Another from Burton, Ohio