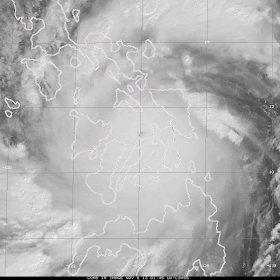
Super Typhoon Haiyan made landfall over the Philippines Thursday afternoon Eastern Standard Time with winds reported at 195 mph. Keep in mind that in the western Pacific, unlike the Atlantic where Hurricane Hunters fly into hurricanes to take wind and pressure measurements, no flights are made into these tropical systems. So wind speeds are estimated with satellite data. Some verification of the 195 mph speed will need to be done before the experts can say with certainty that this is legit.
A great visible satellite image and loop showing the well defined eye as it passed
Now the loop. Click on the image below
Watch the feeder bands weaken through this microwave imagery satellite loop as it passes over land then reorganize once over open water
A really neat image from Eurosat with the curvature of the earth as a reference point. The diameter of Typhoon Haiyan is roughly 400 miles. Hurricane Katrina's diameter was similar.
What are the tropical storms that had wind speeds of 190 mph?
Typhoon Tip in 1979 hit 190 mph at peak intensity in the western Pacific
Hurricane Camille in 1969 had wind speeds of 190 mph when it hit the Gulf Coast
For comparison sake, Hurricane Katrina had wind speeds of 120mp when it hit Louisiana in 2005
According to Dr Jeff Masters of the Weather Underground, typhoon wind speed estimates were too high in the 1940s through the 1960s. He has a list of typhoon wind speeds from that period that are a bit suspect HERE.
The track of Typhoon Haiyan is west over the South China Sea and into Vietnam Sunday.
Northeast Ohio weather and science blog covering severe storms, long term outlooks, climate, behavioral meteorology, technology and other observations
Friday, November 08, 2013
Thursday, November 07, 2013
Tale of Two Different Solutions For Next Week's Forecast
Early in the week, I spoke of the probability of a pattern shift to colder one next week. One model (GFS for you technical weather geeks) was showing 50s and 60s while the other model (EURO) was showing a huge storm over the eastern US with lake effect snow. This is all in the top panel of the graphic below.
Fast forward to today (the bottom panel in the graphic below), the EURO model has been consistent in its depiction of the trough/low in the east (lower right) while the GFS just yesterday and again today is now showing the same thing (lower left).
The "C" indicates COLDER and troughiness. The "W" indicates WARMER and ridging. The RED circle indicates Ohio.
I write all of this to illustrate that weather is much more than looking at computer model outputs. Its understanding what computer projection one is more accurate in certain situations.
Let's see in the days ahead which one nails next week's forecast.
Tuesday, November 05, 2013
Warm or colder mid-November? Fun with teleconnections
I love to play with the huge palette of teleconnections at our disposal. As we transition from fall to winter, the big ones like the AO and the NAO will gradually become main drivers of cold air outbreaks across the North American continent. The PNA will give us the pressure tendencies across the west. This would signify a ridge/warmth out west or a trough/cooler out west. The opposite would occur in the east. So let take a look at what they are saying today on Election Day.
This is all fine and dandy. The problem is that the GFS is showing a HUGE ridge in the east with temperatures well above normal by the 21st.
So what do we make of all this?
First, the atmosphere is an inherently complex and chaotic system. A few teleconnections, while a good tool to use, rarely tell the complete story unless the indices are extreme to one side or the other.
Secondly, there is a distinct trend for the AO and NAO to sag into "cooler, troughy" territory. But for a colder, snowy pattern to develop, the numbers would have to go decisively negative which isn't shown here. The PNA is trending the other direction from the levels (strongly positive) during our brief lake effect snow event in late October. PNA sharply negative indicates a ridge (milder temps) in the east NOT cooler.
So we might have to wait a few weeks for cold enough air to bring a good lake effect snow event.
 |
| The AO |
 |
| The NAO |
 |
| The PNA - Notice the +PNA corresponded to our cold spell in late October |
So what do we make of all this?
First, the atmosphere is an inherently complex and chaotic system. A few teleconnections, while a good tool to use, rarely tell the complete story unless the indices are extreme to one side or the other.
Secondly, there is a distinct trend for the AO and NAO to sag into "cooler, troughy" territory. But for a colder, snowy pattern to develop, the numbers would have to go decisively negative which isn't shown here. The PNA is trending the other direction from the levels (strongly positive) during our brief lake effect snow event in late October. PNA sharply negative indicates a ridge (milder temps) in the east NOT cooler.
So we might have to wait a few weeks for cold enough air to bring a good lake effect snow event.


