Scroll down to the bottom of the graphic and then look left to right. Graphic starts January 1 on the left and ends October 4th 2021. Enjoy!

Scroll down to the bottom of the graphic and then look left to right. Graphic starts January 1 on the left and ends October 4th 2021. Enjoy!
My definition of a perfect weather day is a day with temperatures between 65 and 80 degrees with no rainfall. After analyzing ALL the days (more than 14,000) from 1980 to 2020 and plotting the instances for each day of the year, this is what I found:

Notice the typical increase in late spring, the drop in summer then the big increase in September and early October. Once the pattern flips in mid October it rarely recovers (blue arrow). Enjoy these days while you can :)
 |
| Credit: Nadine Maruszczak, Getty Images |
This past summer featured significant warmth across the northern states, New England and western US. Temperatures were below normal across the deep south.
The next 3 maps below show temperatures vs normal for JUNE, JULY and AUGUST.


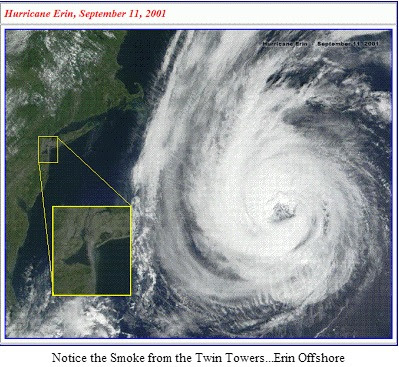
Back in 2011 I thought the raw 9/11 memories would gradually fade into the background of our national consciousness. At the twenty year mark, I was mistaken. 9/11 is like a cut on your arm that never heals completely. Pearl Harbor, Kennedy Assassination and perhaps the Challenger Disaster come to mind as the only tragic events in the past few generations with a similar level of national trauma. Its crazy to think that most people in their early 30s might not have solid memories of the events of that day in 2001 because they were in early grade school. All high school and college students and young adults have grown up in a post 9/11 world. They know nothing else.



No big surprise here. Even after an almost 2 week rainfall break in late July/early August, this summer still ranks 2nd all-time through August 19!


The individual rainfall events have been significant. Here is the number of 1/2" inch rainfall days.


It goes without saying that most of Ohio is well above normal rainfall since June 1st this summer (2021) A large portion of northern Ohio has received 10-15" of rain since June 1 with some areas close to 20 inches! Actual rainfall numbers are highest in eastern Huron, southern Lorain and most of Medina Counties.

Images below show rainfall vs normal. (Note the legend numbers are different for each image. Zero contour is the same for each)

How about last summer 2020? Most of northern Ohio was well below normal--with the exception of portions of Portage, Geauga, Trumbull and Ashtabula counties.


It's hard to believe but there are spots in northern Ohio that are near/slightly below normal with rainfall since June 1st. When you look at the rainfall vs normal OVERALL across northern Ohio this summer the dark blue areas (2-6" above normal) stand out.

But when you zoom in closer, the "drier" areas become more visible. The counties below which have significant areas of below normal rainfall since June 1 (tan colors--see legend to the right) are CUYAHOGA, LAKE, ASHTABULA, ERIE, HOLMES & TUSCARAWAS. I want to reiterate that this doesn't mean these areas are dry and without rainfall. It means that the amount of rain is below normal not zero.
 |
| CUYAHOGA |
 |
| LAKE |
 |
| ERIE |
 |
| HOLMES |
 |
| TUSCARAWAS |
On July 5th we took at look at the summer pattern thus far. Check it out if you haven't already.
Here are the updated rainfall totals VS normal broken down in three periods:
First period is June 1 to June 15
Shades of blue indicated rainfall 3/4" or more above normal. Tan colors indicated below normal rainfall.

Second period is from June 16 to June 30. Heaviest rainfall was from Medina county west to just south of Findlay.

Now the final period is from July 1 to July 11. Heaviest rain across the southern half of northern Ohio.

Finally the summer totals overall from June 1 to July 11.
Purple colors show 8" or more since June 1. Green colors show between 4-8".

Soil moisture has increased significantly over the last week


Our summer outlook issued in late April highlighted frequent rain/storms this summer with above normal rainfall.


Pattern looks to continue through the end of July!


