Showing posts with label humidity. Show all posts

Tuesday, June 25, 2024

Where Does This Recent Tropically Humid Stretch Rank?

Our recent stretch of 90+ degree heat was accompanied by high humidity.  It doesn't always work out that way but in most instances here in northern Ohio and surrounding states, 90 degree heat and high humidity go hand and hand.

Where does last week's summer humidity rank?

Before we answer this, let's set some ground rules.  Since last week's hot and humid stretch was 7 days total (90+ degrees with a dew point of at least 70), I initially used this as the benchmark then dropped it to 6 days in length. 

After downloading the average dew point for EACH DAY since 1950, sorting them only highlighting dew points at/above 70 degrees (considered tropical), here is the list of the most humid 6+ day stretches since 1950:

So where was this past week's high humidity ranked?  TIED FOR 16TH HIGHEST among all 6+ consecutive day stretches with dew points at/above 70.

The last time we had a stretch like last week was in the summer of 2022!


Friday, June 02, 2023

Little Humidity. Little Rainfall. The Complete May 2023 Recap


Lots of colorful  👇   charts here so be prepared!  

We were coming off of an extremely wet April. Temperatures were slightly above normal.  7 of the last 10 days had measurable rainfall.  Back in late April the changes in the tropical Pacific (SOI drop), northern Atlantic (negative NAO) and Bering Sea Low pressure were strongly pointing to a cooler than normal start to May.


Early May Outlook posted back on April 21

The upper level pattern in 7 day increments:  500mB (18,000 feet on left)  Jet stream on the right featured an active west-to-east storm track left over from late April.
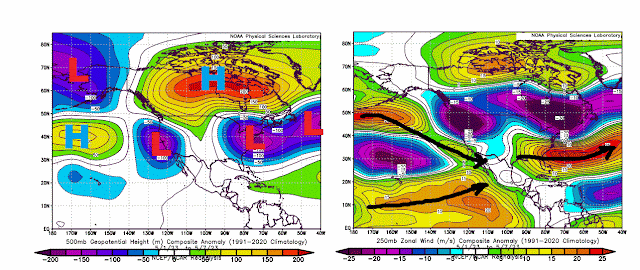
May 1 to May 7

By the second week of April, the ridge over central Canada shifts west and south.

May 8 to May 14

Notice the split flow which emerged in the middle of the month. Storm track along the southern border and west to east through central Canada and into New England.
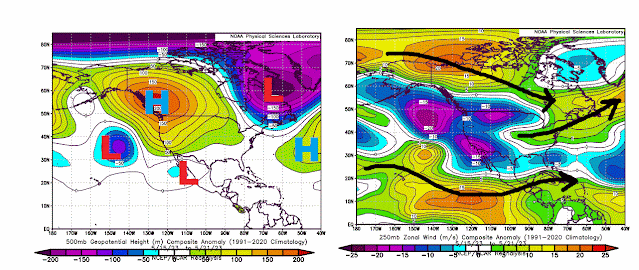
May 15 to May 21

By the final week of May, two pronounced jet stream tracks kept storm systems away from the central keeping the mid-west and corn belt very dry.

Overall temperatures west of the Mississippi and in the upper mid-west were above normal.


The center of the heat was in western Canada.


The split flow kept a large portion of the central US, deep south and Great Lakes extremely dry.


In northern Ohio, we had rain to start the month which skewed the overall totals. 25 of the 31 days were dry.


Temperatures in northern Ohio were slightly below average.  We had more days below than above.  Days in grey were a degree to either side of average.


By far the biggest element was the lack of humidity.  


In fact, April had more humid periods than May. 


We average more than 105 total hours of high humidity in May.  We ONLY had ONE HOUR!  Only 1966, 67, 68 and 1971 compare.


April and May high humidity periods (total hours) compared to past years.


The average northern Ohio humidity in May was the 3rd lowest since the last 1940s.


Severe storm warnings were non-existent in Ohio and surrounding states compared to April.


What about June?  On May 22nd, the tropical Pacific indicated a HUGE drop in the SOI.  Using the historical analogs, the "less humid & dry" pattern looks to continue through the middle of the month.  The projections on June 2 were latching onto this idea bigtime.


What we will watch during the second half of June/early July is how much the severe dry conditions will persist.  If they do, the dry ground could feed the central US ridge further enhancing the heat. More on this in the weeks ahead.


Friday, August 20, 2021

Where Does This Summer's Rainfall & Humidity Rank?


No big surprise here.  Even after an almost 2 week rainfall break in late July/early August, this summer still ranks 2nd all-time through August 19!


The individual rainfall events have been significant. Here is the number of 1/2" inch rainfall days.


28 of the 80 total days have had at least 0.1" rainfall. That is far and away the most of any summer.


The volume of rain water that's fallen across northern Ohio this summer is DOUBLE last summer!


For comparison, 6.6 trillion gallons of roughly 5% the volume of Lake Erie!

Our original summer outlook highlighted ABOVE NORMAL rainfall with an active July which has worked out very well.  We were hoping for near storm days and more dry breaks which would have allowed for more 90 degree days.  My initial call was for 10-15 days above 90. We went with slightly above to account for drier periods. As of this August 20th we stand at only 6. 


Number of severe thunderstorm warnings still running BELOW AVERAGE.


Continental upper level pattern has matchup pretty well with our initial outlook. 500mB heights vs normal in the images below show every 15 days starting June1st. Notice the frequent LOW in the central US and high pressure ridges flanking it.


How about the humidity.  Where does this summer rank?  2021 ranks 5th since 1948. Interesting summer of 2018 was more humid overall as was the summer 2010. The most humid summer was 1995


The extreme humidity has come in spurts.  We measure extreme humidity period in hours above a certain level. So far this summer's extreme humidity is lagging behind last year. In fact EVERY summer in the last 5 years has featured MORE EXTREME humidity than summer 2021.  See image below.