Showing posts with label long range forecasting. Show all posts

Friday, December 05, 2025

Coldest Start to December in Northern Ohio in Years. Does It Continue?

Per the long range outlook issued back on November 11, the cold arrived around Thanksgiving weekend and has not looked back. 


Temperatures for the first 3 days of December have been well below normal across much of the US. 

The FOX 8 forecast continues to show well below normal temperatures.


The main drivers of the colder pattern are:  A favorable tropical Pacific (MJO in phase 7-8) and a bit of upper atmospheric warming over the North Pole.


The first 15 days of December look to stay below normal across northern Ohio for the first time since 2005!  It's only happened two other times in the last century.


Its not just here in Ohio. Most of the country has had well below normal temperatures since Thanksgiving week.


Here are a few years that were similar to the current cold:  Temperatures vs normal on the left.  Upper level pattern on the right.  Notice how widespread the cold was in each instance along with persistent low pressure around the Great Lakes/eastern US.


Interestingly, the cold during the first half of December has been continuous but it hasn't originated from over the North Pole.  High pressure near Alaska has developed from time to time over the last week which has kept the central US trough/active pattern with frequent precip/snow.  But it's strength has been fluctuating. The low over Hudson Bay is trapped in between the Alaskan high pressure ridge and the low over Greenland. Definitely no sustainable blocking pattern capable of tapping arctic air.


What has to happen for the colder pattern to become extremely cold?

The Greenland low needs to transition to a high pressure block along with a sustainable Alaskan block.  That hasn't happened...yet.

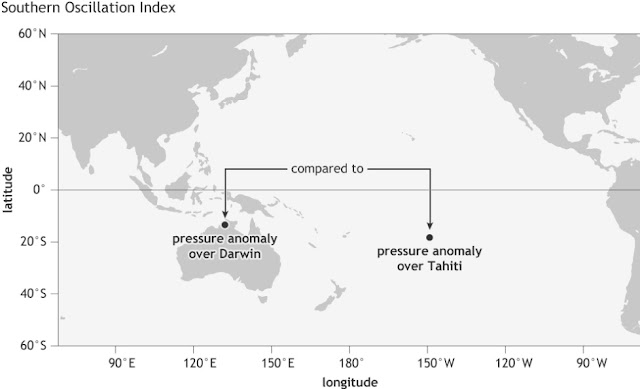
Recently, a huge drop in the SOI (southern oscillation index) occurred. This indicates huge pressure pattern changes between Australia and Tahiti in response to the tropical changes (MJO moving into phase 8)


Notice on the long range outlook into the second half of December.  BOTH blocks seem to develop:

WATCH FOR CONSISTENT HIGH PRESSURE OVER ALASKA
WATCH DEVELOPMENT OF HIGH PRESSURE OVER GREENLAND
WATCH LOW DEVELOP CENTRAL US/HUDSON BAY


Here is the take home forecast message:

*  Cold continues but nothing extreme for southern Great Lakes through mid-December.
*  Active storm track continues with frequent snows across the central US/Great Lakes.
*  Short-lived break around December 16-18
*  Then cold reloads as blocking pattern establishes itself last 10 days of December/early January


Watch how the cold continues, a small break mid-month before the cold build around Alaska which heads south around the 20th.  Get ready for a Arctic Christmas!


Tuesday, December 07, 2021

December Warmth is Coming. So When Did We Know?


For several years, I've been implementing a variety of research in creating long range outlooks for the Ohio Valley and Great Lakes on the 18-21 days time scale. In fact last year, almost a year to the day, I issued a long range December outlook using the same techniques highlighting a panhandle snow track on the 8th  (Outlook was dead on. The percentage was too low)   CLICK HERE FOR THE POST 

One of the variables I use is daily changes in the Southern Oscillation Index (SOI).

The SOI is the different in pressure between Darwin, Australia and Tahiti.

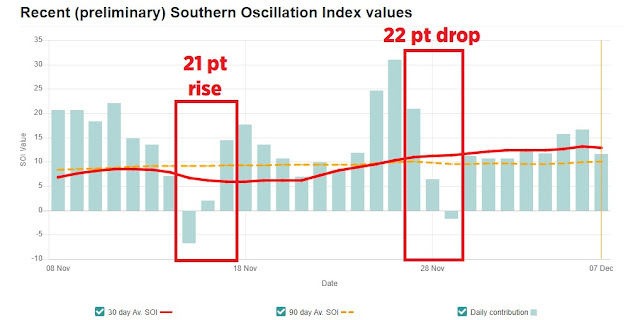
Look at the daily SOI values since early November.  Notice the period where the SOI rose near 20 points over a 2 day period and a drop of more than 20 points. First period was Nov 15-17, the second was Nov 14-16.


The sharper the change (rise or drop) the greater the effects in other parts of the world. Meteorologist Joe Renken was instrumental in doing the research showing what these changes mean 2-3 weeks days in the future across North America in different seasons and different ENSO states (El Nino, Nada or La Nina).  You can read the paper HERE. 

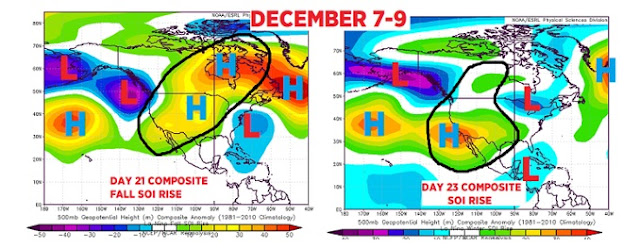
The first sharp SOI rises above yielded these upper level composites in similar seasons/conditions. Notice the ridge in the central US and the lingering Great Lakes/Eastern US low pressure.  I posted this a week before Thanksgiving. The seeds were for the December warmth were planted here.

SOI composite: Day 21 & 23 ahead

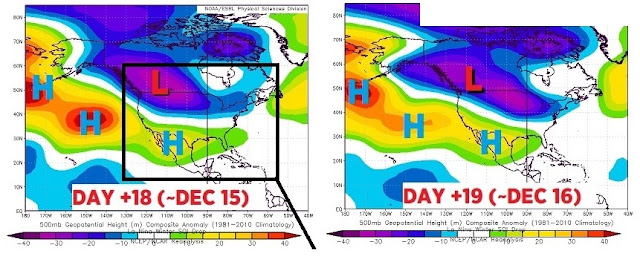
The SOI drop (right red box above) gave us these composites.


You can see the high pressure/warmth across the southern states.  What's also apparent is the lingering low pressure from the British Columbia coast east along the US/Canadian border and into the Great Lakes. A big indicator that Clipper Systems and short-lived intrusions of cold will interrupt the warmth. We have already seen this up & down pattern in reality thus far since Thanksgiving.  Remember that this pattern was indicated in late November.

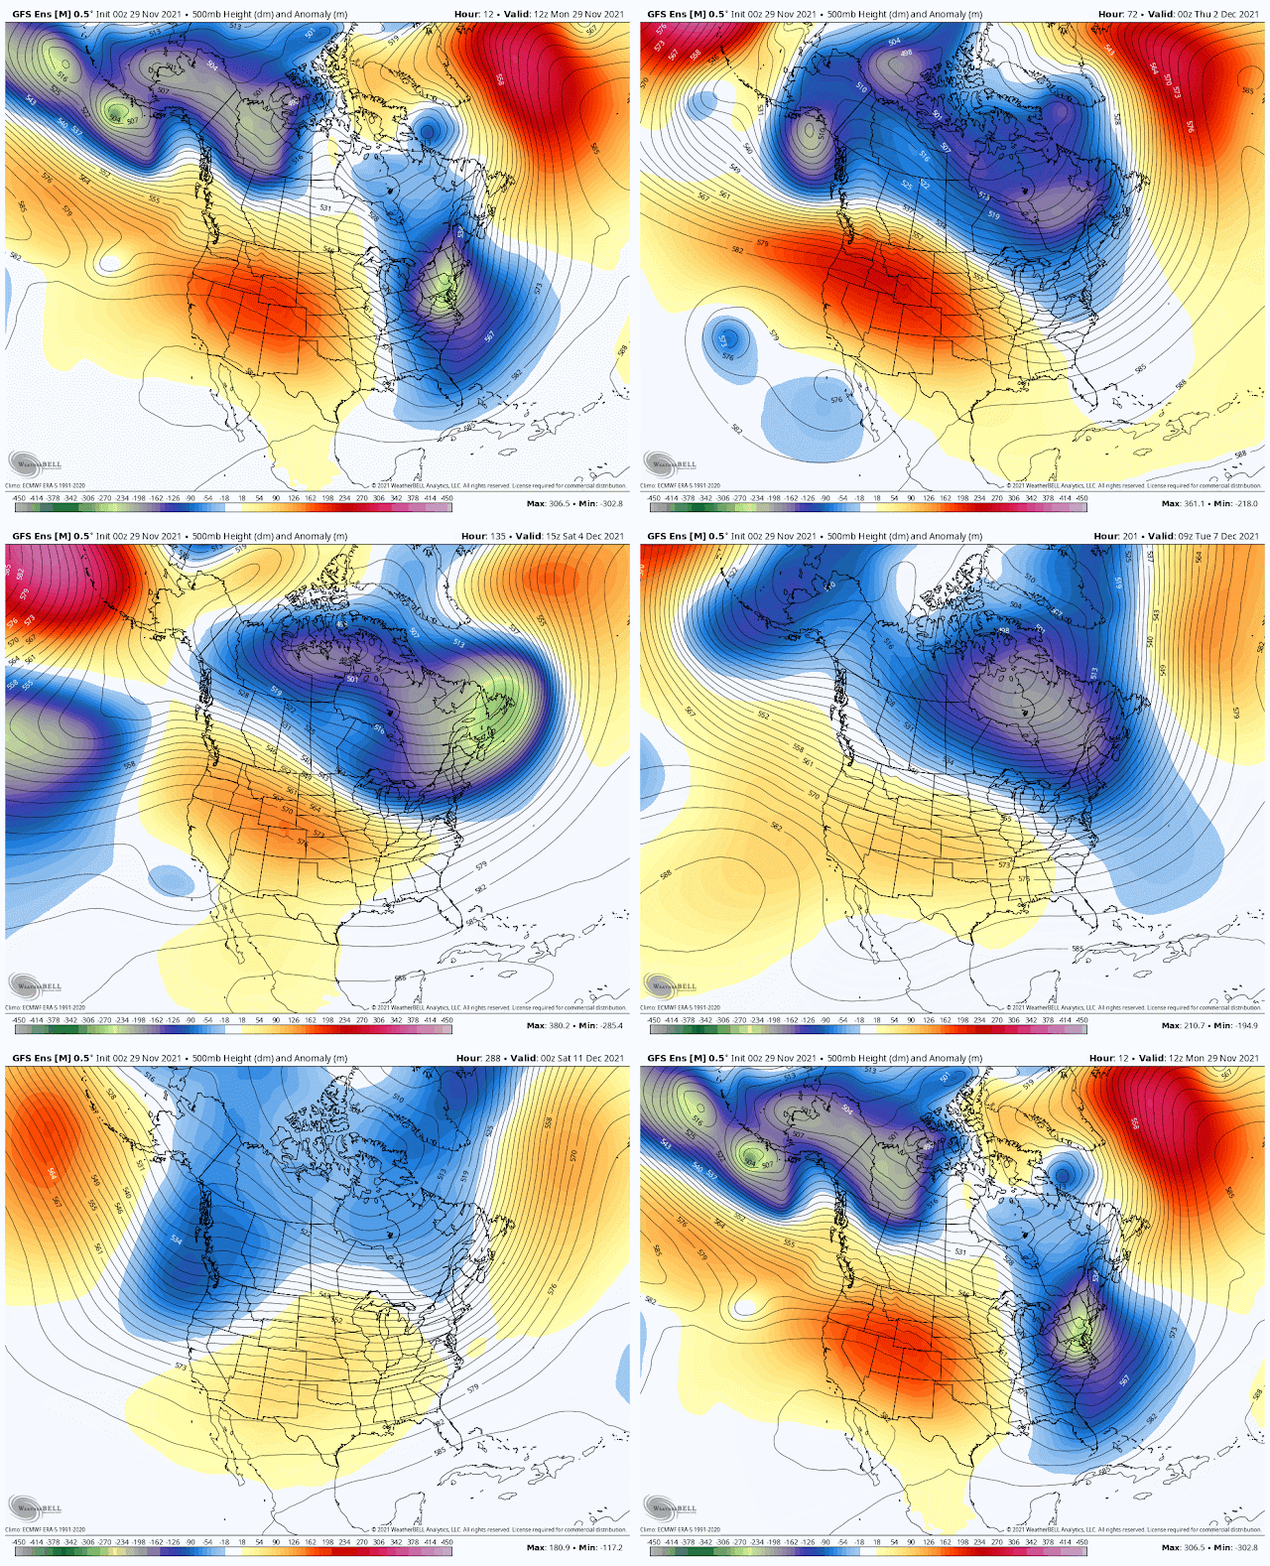
The actual computer model output (GFS) on November 29 mirrored the composites!


So what did all of this SOI analysis before Thanksgiving tell us about the mid-December outlook?  It tells us that above normal temperatures were coming. We'd have brief interruptions of cold with local snow from time to time before the longer lasting period of "warmth" around the middle of the month. As of this writing (December 7) I still think we will see a 60 with sun BEFORE Christmas week!

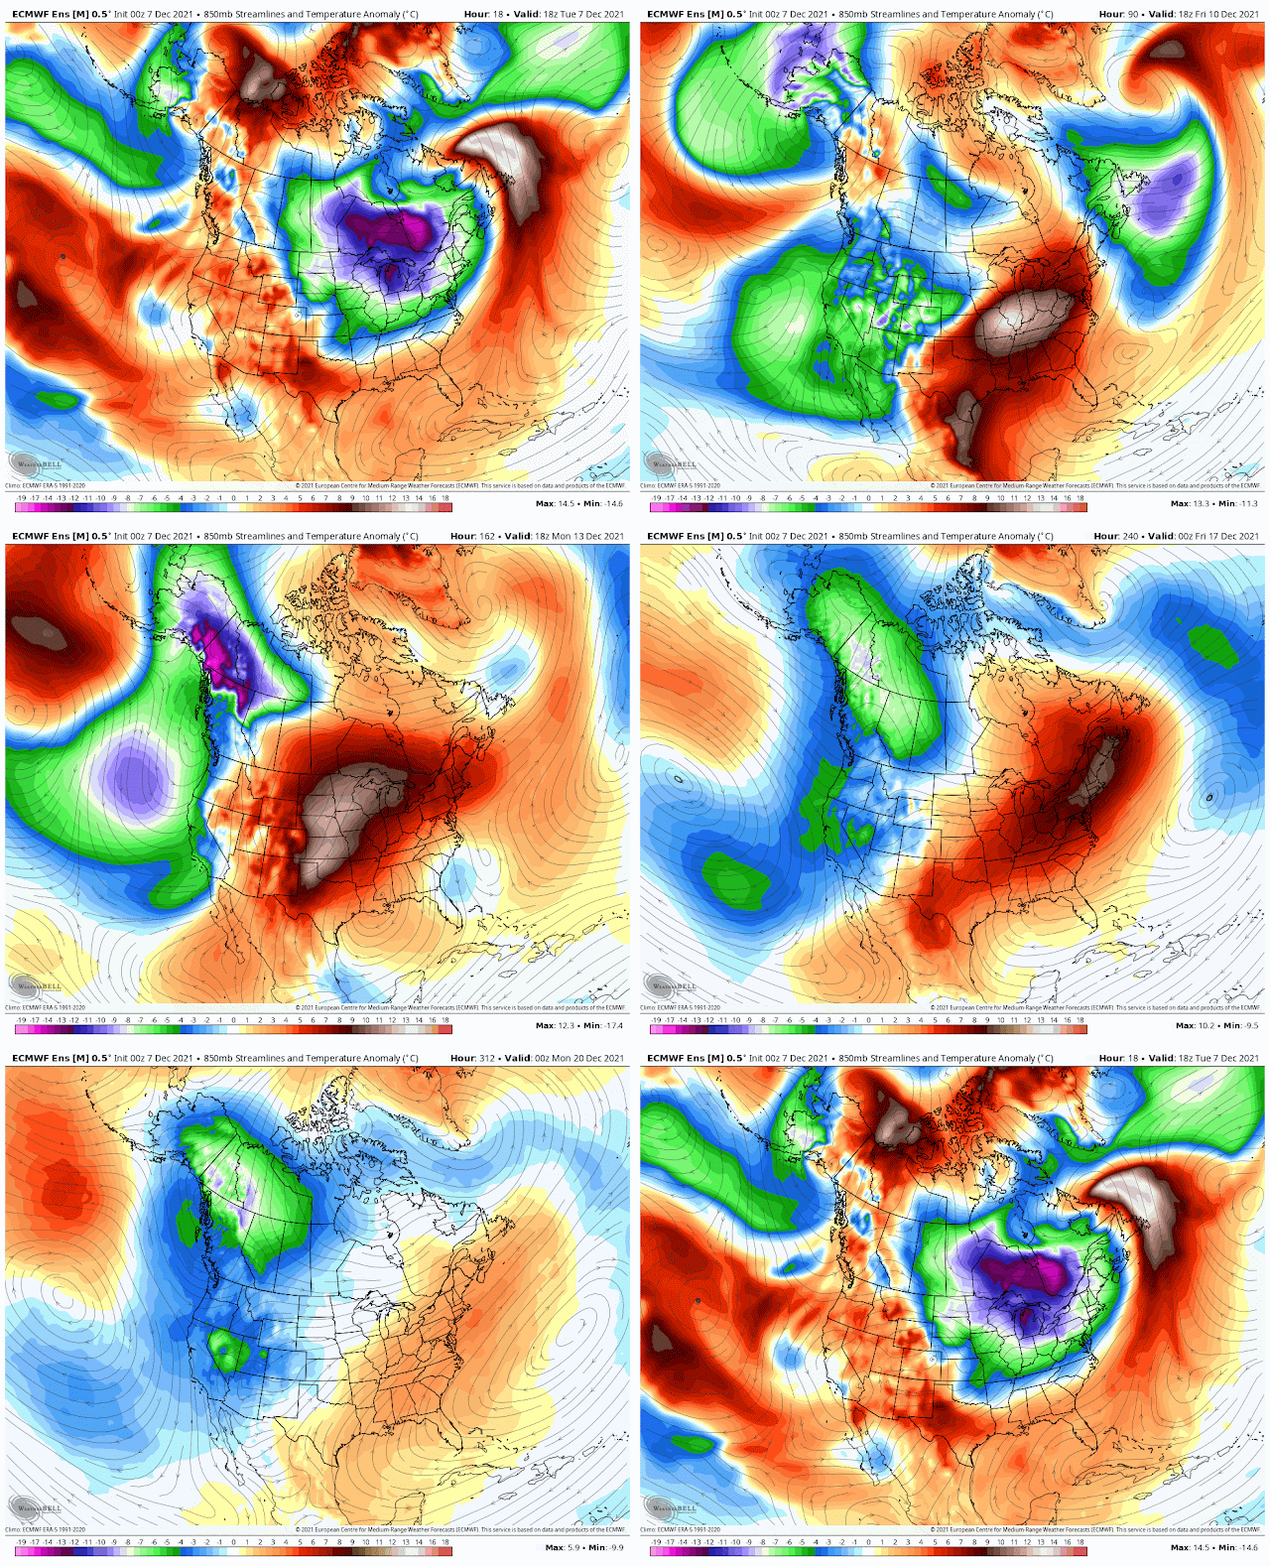
The current model output (December 7th) shows the warmth finally popping across the eastern US. Loop is from Dec 7 to December 22.  

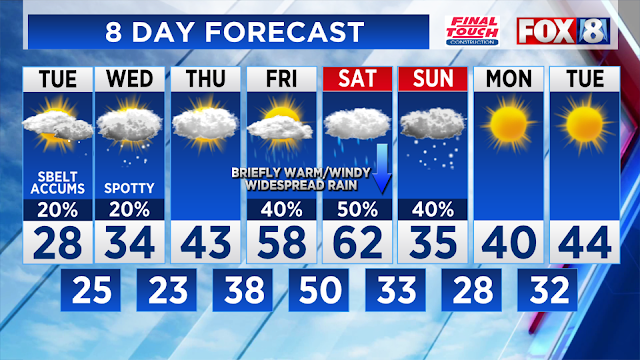
Our northern Ohio 8 day forecast illustrates the up and downs.


Note that the SOI was only one of several other variables (not mentioned here) were used in creating the mid December outlook. 

Who says we can't predict the weather 20 days in advance!

Any questions send me an email:  scott.sabol@fox8.com

Tuesday, January 12, 2021

Will Lake Erie Freeze Over This Winter?

If you live around the Great Lakes especially downwind in wintertime, you probably experience lake effect snow especially during the first half of winter when the lakes are warmer and free of ice. Here in northern Ohio we live on the southern edge of Lake Erie (warmest and shallowest lake) directly in the lake effect snow firing line.  More ice on Lake Erie reduces lake effect snow potential. So each winter by mid January, the same question pops up: Will the lake freeze?

Photo Courtesy:  Scott Sabol February 2013

Let's see how much ice is on the lake right now (as of January 12). Roughly 0.6% 

(Right after Christmas, we reached 1.2% ice coverage on the 27th of December before it melted off)


Ice coverage is well below normal so far (red line is this winter 2020-2021 through 1/11)

For initial clues on where this year's ice coverage might end up, Great Lakes historical ice coverage data (GLERL) might shed some light. This data goes back to 1973. (I wish it went back further). 

The graph below shows the historical ice coverage through January 8th since the early 1970s. 

How many years have had similar (20% and under) ice coverage at this stage of the winter--January 11th?  24 total since 1973.

Which one of those years ended up with more than 80% or more ice coverage? Only 6:  1985, 1997, 2000, 2004,, 2005 and 2019


In these years ice coverage jumped significantly in just a few weeks!


Why did those years develop ice so quickly?  Look at the temperatures vs normal across the Great Lakes and Ohio Valley between January 11th (low ice coverage) and the day when ice coverage reached at least 80% FOR EACH OF THESE 6 YEARS. 

I tabulated the number of days where the high temperatures in Cleveland stayed at/under 32° and the overnight lows stayed at/under 15°.

The below normal cold wasn't just relegated to Ohio. In each year, the cold was widespread over multiple weeks!

1985: Every day was under 32 degrees. Half of nights under 15 degrees


1997: Half of days under 32 degrees. 10 of 13 nights under 15 degrees


2000: 14 of 18 days under 32 degrees. 11 of 18 nights under 15 degrees


2004: 9 of 15 days under 32 degrees. 10 of 15 nights under 15 degrees


2005: 10 of 14 days under 32 degrees. 8 of 14 nights under 15 degrees


2019: Half of days under 32 degrees. Only 8 of 20 nights under 15 degrees

The Lake Erie water temperatures in these years started out well above freezing between January 11 and January 13. By day 10 (January 23) the water temp had dropped to between 32 and 34 degrees...


...It wasn't until the water temperature dropped under 34 degrees between January 21 and 24 that the ice coverage increased.  The ice coverage jump day to day (see below) was significant beyond day 10 once the water temperature dropped and the cold air temperatures were firmly established.  


*  What are the shortest jumps from 20% to nearly 80% ice coverage?

2/7/1973 to 2/13/1973:    17% to 81% in 6 days
2/6/1995 to 2/11/1995:    16% to 80% in 5 days
1/17/1997 to 1/22/1997:  24% to 77% in 5 days
1/19/2005 to 1/24/2005:  24% to 82% in 5 days
2/4/2013 to 2/10/2013:    20% to 82% in 6 days
2/10/2016 to 2/15/2016:  0.7% to 79% in 5 days

In each of these years (with the exception of 2016), the ice coverage remained at around 80% for 3+ weeks

*  The average ice coverage for specific dates between 2010 and 2020:

January 15:    38%
January 20:    40%
January 31:    46%
February 10:  56%
February 20:  50%
March 1:        49%
March 15:      34%
March 31:      17%

Average dates where ice coverage is highest:  February 13-18th

Historically here is the daily ice coverage for each year in January and February. 


Based on the temperature forecast for the remainder of January and into early February, what are the chances the lake freezes over--80% or more?   Pretty small.

We are entering a 2 week stretch through the end of January with periods of colder than normal temperatures.  Based on what I am seeing, on the higher end I think the ice coverage will be between 40-50% by month's end.  In reality I believe it will verify closer to 25%.

Bottom line, Lake Erie will stay open for lake effect snow business into early February!

The first 10-14 days of February will be key to the rest of the winter Lake Erie ice coverage. 


Monday, January 04, 2021

How Will January's Weather Play Out?

We've already have a few decent snow events this winter.  The first was on December 1st.  The second was Christmas Eve and Christmas Day, the snowiest Christmas Eve/Day since 1995. The National Weather Service here in Cleveland has a great summary HERE .


Now that we are a few days into January 2021, what does the current pattern tell us?

If you remember back on December 8th on my post, I mentioned the possibility of a GREENLAND BLOCK (red color) which would increase the possibility of cold and snow to finish out December.

MODEL animation from December 8 showing potential Greenland Block

It was too early at that point to say for certain that the mid-late December pattern would be a harbinger of what was to come in January. Now look at the animation below. See how the block (red color) near Greenland is staying in place.  Also see how the western North America ridge (red colors) is starting to develop. This is a bigtime one-two punch: Ridge west (potential block) and a ridge (Greenland block) east.


The jet stream is trending MUCH stronger. Look at the warmer colors across the eastern US. East coast snow lovers will love this!


Top years with similar pattern shows below normal temperatures the 3rd week of January

So after watching the pattern over the last month becoming more persistent, as of this writing (January 4) all this seems to be foreshadowing more cold and deeper southern storm systems!

Some projections are starting to show this idea.

First 2 weeks of January snowfall

3rd week of January snowfall projection

What about the Polar Vortex? Are there indications this become more unstable in the weeks ahead?  Absolutely. 

Look at the surface map over Asia and the large surface high pressure. 

Meteorologist Mike Adcock noted this on Twitter on December 28th:  "Looking at 2100 UTC obs in Mongolia, Tosontsengel is reporting 1089.5 hPa. This station is the record-holder from 2001 (1084.8 hPa). Further, Tsetsen Uul (labelled w/ H) is reporting 1093.5 hPa (32.29"). These, along with other reports, if verified, would break the world record."


This Siberian high pressure ridge is very large. Its been locked in since last month.


Climate specialist Rick Thoman also noticed the abnormally low pressure near the dateline on December 30th: "The GFS is all in for the deepest cyclone in a long time in or near Alaska waters. I've listed the four storms since 1975 that I know of with an analyzed minimum pressure below 930hPa".

The jet stream has been extremely strong off of Asia east into the northern Pacific which probably enhanced the storm above around New Years Eve. Notice the up and down jet across North America.


What does this have to do with the Polar Vortex and the potential for cold for the eastern US?

The super-high pressure center over Mongolia if located just right creates friction along the Mongolian Mountains. This process creates atmospheric waves that propagate into the stratosphere! The mountains change the pathway so that these waves can significantly weaken the stratospheric jet stream. This can cause warming events at the top of the atmosphere called Sudden Stratospheric Warming events. When these occur, its just a matter of time before the "top-of-atmosphere warming" creates a weakening of the jet stream closer to the surface in the northern latitudes along with expansion of cold around the north pole. A weaker polar jet stream means the Polar Vortex can move south easier. 

See how the temperatures have jumped recently in the stratosphere


Also notice how the wind direction made a big directional change

Here is great tutorial on how this all fits together.


It doesn't happen overnight.  Its usually weeks down the road.  

See how the cold reloads across western Canada and then drains into the central US by the 20th?


Expect our chances for MORE wetter snows second half of January!