
Jose Ramirez is on a torrid pace. He leads the league with 62 RBI. He's second in slugging percentage at 0.649. Looking at more advanced statistics, the story remains the same. His 0.437 wOBA is good for 4th in MLB. His wRC+ of 193 ranks 5th.
What stands out among the top hitters in run creation is their strikeout rate. The average rate of the players below (minus Ramirez) is 19.8%. Jose Ramirez strikeout rate is... 7.4%.

Jose has always been a good contact hitter. His contact percentage across the entire strike zone has been between 86-90% over his career. The increase this year is 3% versus last season. What's more noticeable is his productivity increase.


Look at his out-of-zone contact. A 10% jump compared to 2021!

He's making more contact at pitches out of the strike zone! Contact is one thing. How productive is his contact out of the zone?
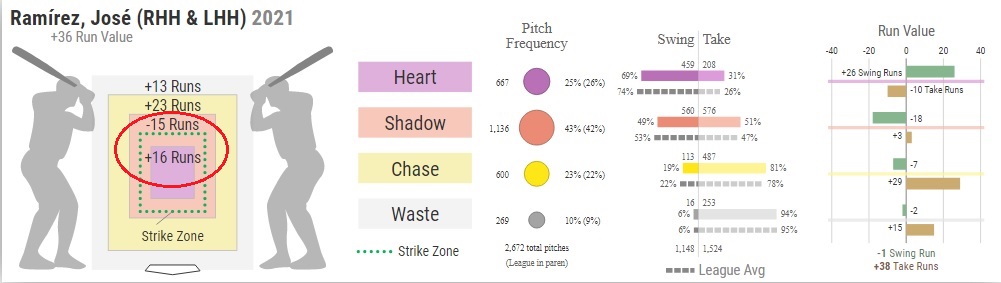
This graphic comes from Baseball Savant. We can assign run values to the strike zone based on each base state during a typical game. Here's a detailed explanation.
Take some time to familiarize yourself with the graphic. There are four regions: HEART, SHADOW, CHASE, WASTE. The total number of runs for each region is indicated on the left. For example in 2021, Jose Ramirez's center of the zone total runs was +16. Yet his shadow zone was -15 runs. He was near league average in swings in the shadow zone, his productivity in runs was negative!

Compare last year to this season through June 16.

His shadow zone so far this season: +5 runs vs last year which was -15 runs.
So far this season Jose Ramirez is 5th in MLB in runs in the shadow area. In 2021 he was 188th!
Basically, he's being more aggressive with more swings at pitches in the outer part of the strike zone and in the area just outside the zone.

Interestingly he is not hitting the ball as hard as last season. Roughly a 10% drop in hard hit balls. This hasn't impacted his productivity as his overall wOBA is higher than in any previous season through mid June. One reason for the reduction in hard hit balls is that he is hitting the ball more up the middle and pulling the ball less.
 |
| wOBA Hard Hit% Center Hit% |
 |
| wOBA Hard Hit% Pull% |
Here are his slugging percentage for each count over the last 5 seasons (not counting 2020). His slugging is lightyears ahead of last season on the first pitch.

The changes year-to-year sum it up: He's made significant improvements when ahead in the count especially at 1-0, 2-0, 3-0 and 3-1. Also, his slugging jumped from 0.493 to 0.613 after the 7 inning!

Sure his production with the bases empty is in line with last year. However he is productive when it counts.
 |
| wOBA with runners on base/empty |
Let's see if these trends continue.