Showing posts with label sabermetrics. Show all posts

Monday, October 10, 2022

MLB 2022 Recap - Were There Any Significant Changes?


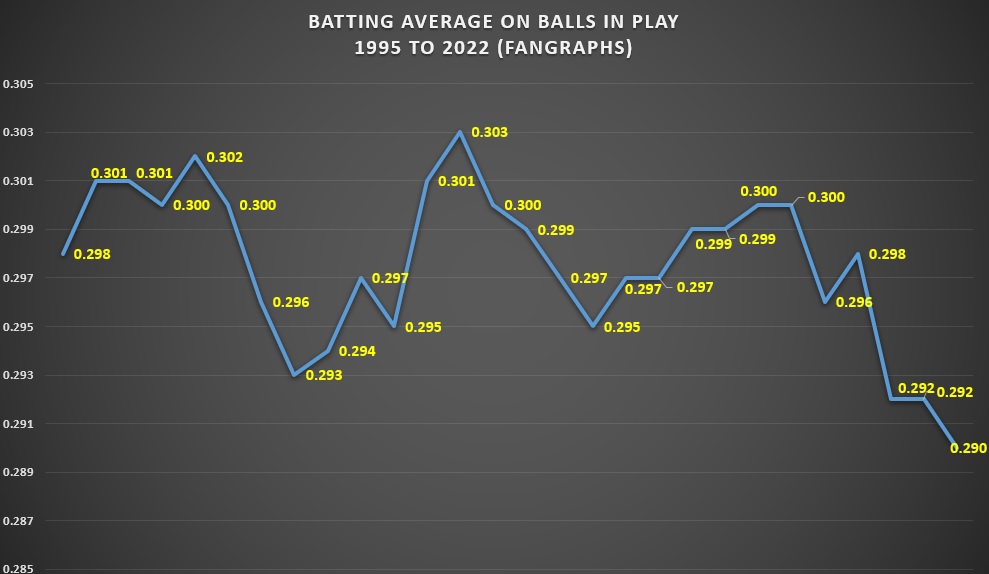
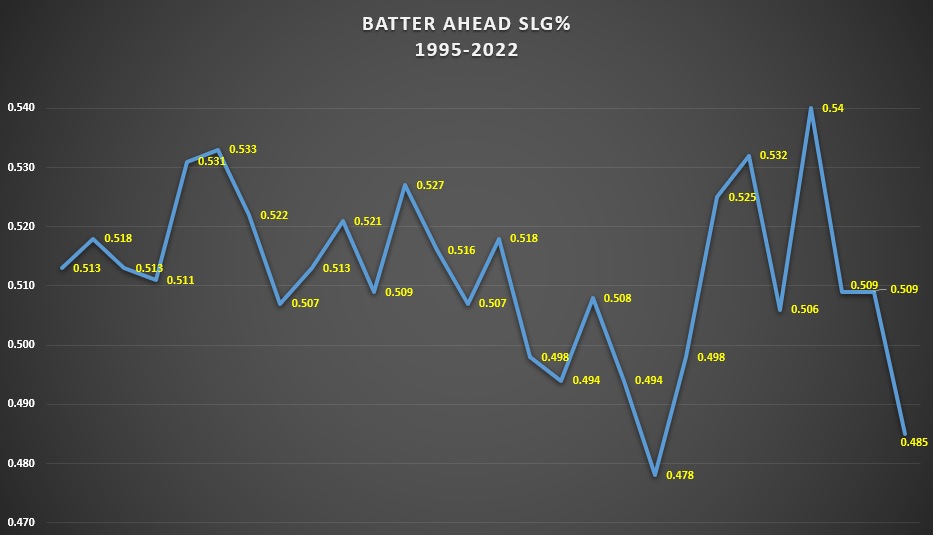
Here are numerous charts showing where the 2022 MLB season compares to recent seasons. 

All data is from Fangraphs and Baseball-Reference


Friday, June 17, 2022

What's Different Between 2021 Jose Ramirez and 2022 Jose Ramirez?


Jose Ramirez is on a torrid pace. He leads the league with 62 RBI.  He's second in slugging percentage at 0.649. Looking at more advanced statistics, the story remains the same. His 0.437 wOBA is good for 4th in MLB.  His wRC+ of 193 ranks 5th. 

What stands out among the top hitters in run creation is their strikeout rate. The average rate of the players below (minus Ramirez) is 19.8%.  Jose Ramirez strikeout rate is... 7.4%. 

We've seen Jose Ramirez put up great numbers in the past. What is different about this season vs last season and others?  Let's examine contact.

Jose has always been a good contact hitter. His contact percentage across the entire strike zone has been between 86-90% over his career. The increase this year is 3% versus last season. What's more noticeable is his productivity increase.

His in-zone contact is virtually identical to last year. Not much change.

Look at his out-of-zone contact. A 10% jump compared to 2021!

He's making more contact at pitches out of the strike zone!  Contact is one thing.  How productive is his contact out of the zone? 

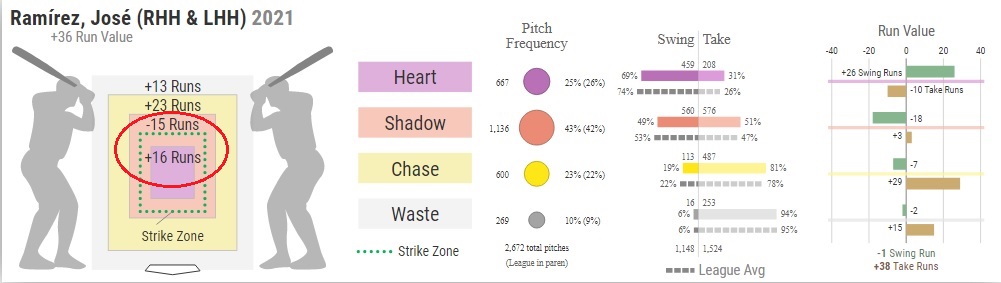
This graphic comes from Baseball Savant. We can assign run values to the strike zone based on each base state during a typical game. Here's a detailed explanation.

Take some time to familiarize yourself with the graphic. There are four regions:  HEART, SHADOW, CHASE, WASTE.  The total number of runs for each region is indicated on the left.  For example in 2021, Jose Ramirez's center of the zone total runs was +16.  Yet his shadow zone was -15 runs.  He was near league average in swings in the shadow zone, his productivity in runs was negative!


Compare last year to this season through June 16.


His shadow zone so far this season: +5 runs vs last year which was -15 runs.  

So far this season Jose Ramirez is 5th in MLB in runs in the shadow area. In 2021 he was 188th!

Basically, he's being more aggressive with more swings at pitches in the outer part of the strike zone and in the area just outside the zone.


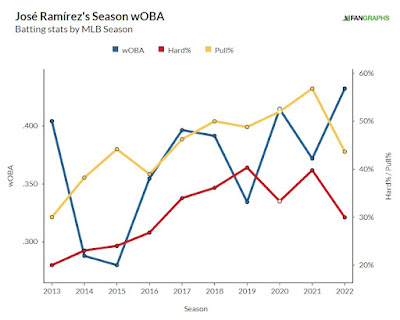
Interestingly he is not hitting the ball as hard as last season.  Roughly a 10% drop in hard hit balls. This hasn't impacted his productivity as his overall wOBA is higher than in any previous season through mid June.  One reason for the reduction in hard hit balls is that he is hitting the ball more up the middle and pulling the ball less.
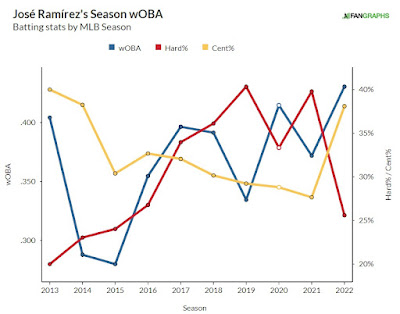
wOBA  Hard Hit%  Center Hit%

wOBA   Hard Hit%   Pull%


Has he made changes in his approach in different counts?

Here are his slugging percentage for each count over the last 5 seasons (not counting 2020).  His slugging is lightyears ahead of last season on the first pitch. 


The changes year-to-year sum it up: He's made significant improvements when ahead in the count especially at 1-0, 2-0, 3-0 and 3-1.  Also, his slugging jumped from 0.493 to 0.613 after the 7 inning!


Sure his production with the bases empty is in line with last year.  However he is productive when it counts. 
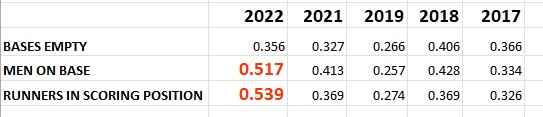
wOBA with runners on base/empty

Let's see if these trends continue.


Friday, July 13, 2018

Cody Allen 2018 vs 2017

Photo by Elsa/Getty Images
Cody Allen, closer for the Cleveland Indians is the bookend of the worst bullpen in baseball this year. He's only blown one save through the All-Star break but his last outing in a non save situation--2/3 inning, 6 runs, 3 hits, 2 walks--had me wondering if this performance is an indication of something more substantial brewing over time.  Some basic pitching numbers along with Statcast data can shed light on this.

*  Opponents are batting more than 200 points HIGHER against Allen with runners in scoring position than last year.

RUNNERS IN SCORING POSITION
                GAMES   PLATE APPEARANCES   OPP AVG.       2B   HR   RBI
2017:            69                    50                              0.226             1      2     16
2018:            32                    44                              0.432             3      1     14

*  Allen's has already walked 15 batters in 32 games. Last year his total was 21 with double the number of games pitched.

            RESULTS WITH COUNTS 3-0, 3-1, 3-2
                 GAMES         HITS/AB           BB   SO   RBI   HR   R
2017:             69            8-32  (0.250)     21    12     6       4      6
2018:             32            4-18  (0.222)     15     4      2       1      2   (THRU JULY 11)


*  Allen's velocity has steadily dropped from its peak in 2013 to its present level similar to last season


*  Batters are swinging at more of his pitches in the strike zone vs any other year since 2012.  Batters are more aggressive vs Allen.


* Yet opponents are also swinging and missing significantly more this season


* Batters are not swinging and missing at pitches up in the zone as much as last year


However he is still throwing pitches in roughly the same locations regardless of the batter


The result has been more fly balls this season than in any other season


Expected slugging percentage (formulated using exit velocity and launch angle from statcast) shows an increase from last year.

The increase in flyballs and expected slugging percentage is probably due to pitch location. His primary pitches (fourseam fastball and curveball) are higher in the zone this year vs 2017.


He has made adjustments to right handed batters this year and its showed. The real damage has been done on the other side of the plate where lefties are enjoying a large increase in OPS.  4 homeruns so far thru July 11th versus only 1 last year. 15 hits in roughly half the number of at bats.


Why is this happening?  He's leaving the ball over the plate more this year to lefties.
               
                              AB    H     HR   RBI   AVG      OPS
2017  LEFTIES    110   23      1        7     0.209     0.545

                           
                              AB    H     HR   RBI   AVG      OPS
2018  LEFTIES     59    15      4      10     0.254     0.871 (THRU JULY 11)


The frequency of balls GROOVED (right over the plate) is higher with both his fourseam fastball and curveball. The increase is more pronounced with the fourseam. 


This has resulted in more flyballs.  Batters are pulling the ball more.  The number of weak hits is lower; the number of solid hits is the highest in three years!


The bottom line is Cody Allen is less effective when he doesn't locate his two pitches. This is essential now versus other years due to his decline in velocity. He needs to make adjustments DOWN in the zone especially to left handed hitter or the second half of the season will be more of the same