Showing posts with label cleveland. Show all posts

Friday, April 04, 2025

Cleveland Opening Day Baseball History Updated


Since the middle of March, we've been watching the potential for some pretty serious cold for early April around Opening Day at Progressive Field.  There's been a lot of warming in the stratosphere over the north pole (warm colors below) which usually takes a couple of weeks under ideal circumstances to make its way down into the troposphere where weather directly impacts us. (Often times the stratosphere warming doesn't propagate down into the troposphere so the upper atmospheric warming remains, what we call, decoupled from the lower atmosphere. In those cases, little impact in the form of cold occurs.)


Warming at the top of the atmosphere creating cold at the surface seems counterintuitive but that warming and the stratosphere creates high pressure at the surface in the high latitudes.  Here is a primer from NOAA. There are many ingredients that have to be present for this to occur. Some originate in the tropics which make their way to the pole.


Where that change propagates south is typically where the cold sets up. In many instances, the long-range computer models have a difficult time ascertaining this.

Here is European Model each day from March 26 through April 1 showing temperatures for Tuesday afternoon April 8th (Opening Day in Cleveland). Notice it didn't pick up on the cold over the Great Lakes/Ohio Valley until March 29. Each day the cold became stronger and more pervasive across the northern half of the country.


Today (April 4), notice how extensive the cold is for April 8. The normal high is in the mid-50s for the second week of April. This translates to mid 30s!


850 mB temperatures (5000 ft level) drop to -12 to -14C. Good bet for some lake effect snow with accumulations late Monday into Tuesday.  It is late in the season so the lake water temperature is around 34 degrees Fahrenheit. You need a lake water temperature 850 MB temperature difference of at least 13°C  to start generating lake effect snow. So that difference is going to be pretty close to the cutoff.

We all remember Opening Day 2007. The game was cancelled then moved to Milwaukee. If that game were to be played in Cleveland, it would have been 28°


Technical weather aside, I did some research looking at all of the Opening Days for not only Cleveland Guardians history but ALL Cleveland professional baseball history going back to 1871 when they were called the Cleveland Forest Citys. This is when Cleveland professional baseball was in the National League. They were also known as the Cleveland Spiders and the Cleveland Blues.

Here is the complete list. It shows the year, date, either the game time temperature or the high temperature for the day depending on what was available (color coded), the result of the game and whether or not we had precipitation that day.


A few things to note: 

  • There have been 12 home openers where we had game time temperatures in the 30s:
     

  • The 1979 home opener was the coldest at 32°.
  •  1899 opening day at League Park was the warmest. Game time temperature 84°.
  • The most precipitation ever on opening day was 1981, April 11th at the old stadium. We had 1.44" of rain.


Most recently the 2006 opening day had 0.61" of rain. 

Opening day April 13th 1962 we had some scattered snow. 


Thursday, July 20, 2023

Why So Much Smoke From Canada This Summer?


The air quality across the Great Lakes, Ohio Valley and much of New England recently has been very poor due to the smoke from Canadian fires in eastern Ontario and portions of Quebec.  

June 28 Air Quality Levels

June 28 Air Quality Over Great Lakes

Earlier in the week, smoke from the fires in western Canada were the culprit. 

Current Conditions in Canada

Area Burned vs All Years Since 1980

Fire Stars Since 1980

Why has smoke from the north impacted our air quality and sky condition this summer?  Has this happened before?  Is this low air quality unprecedented? 

The smoke movement has to do with the overall weather pattern across North America. In late May and June the pattern featured an abnormally strong and stagnant ridge of high pressure over central Canada and high pressure over Texas. The flow is clockwise so the winds steered the smoke from Quebec south into the Great Lakes. Now in July the ridge over Canada has weakened. A trough has replaced the ridge. The dominant flow has been northwesterly bring in fast moving cold fronts from the west and northwest recently. The flow steered smoke from the fires in western Canada into the upper mid-west and Great Lakes. 


Watch how the high pressure ridge (warmer colors) developed in May across Canada.  Also notice how the ridge faded and emerged further east then central Canada by early June. Also notice how there was little southern high pressure. Pockets of blue indicate low pressure.  No sign of the Bermuda high to establish a southwesterly wind across the central US keeping the smoke north.

Upper Level Pattern (3 day periods) - Early May thru June 24-26

This abnormally strong Canadian ridge created record setting temperatures in May and June across western Canada


Soil moisture dropped both in western and eastern Canada.  Dry conditions began to spread across the Great Lakes.


When we look at the air pollution data since 1980 for Cleveland and surrounding locations, the time of year where pollution becomes more of a problem is summer.  Warm and often times stagnant air creates conditions that keep pollution from dissipating.  What really stands out on this graphic is the frequency of low air quality in the 1980s and 1990s between May and August. Look at the summer of 1988. 36 days with highs in the 90s with a few 100 degree days and little wind. Compare this to early summer of 2023 (bottom of graphic - red arrow). Only a few days in late May, June 28 and July 17-18 air quality was considered poor.


This was the same pattern that kept the humidity in northern Ohio at decades low levels in May and most of June although the recently higher July humidity brought up the seasonal average.


Both summer time high pressure ridges are not linked. Often times they will merge briefly. That has not happened this summer.  Below is a long range forecast for July 31, 2023.  Notice both ridges are distant.


This is also the same pattern that has kept most of the extreme heat in the deep south and away from the Ohio Valley. 


If this were a typical late spring and summer with the Bermuda High establishing itself over the southeastern US, the dominant flow would be southwesterly keeping the smoke up north. Look for this pattern to continue from time to time in August and September. The developing El Nino is probably a contributor.


Monday, April 17, 2023

What's Driving The Big Temperature Changes?

We just came off of the warmest seven day period since the middle of last September. 

64, 74, 80, 82, 82, 80, 79

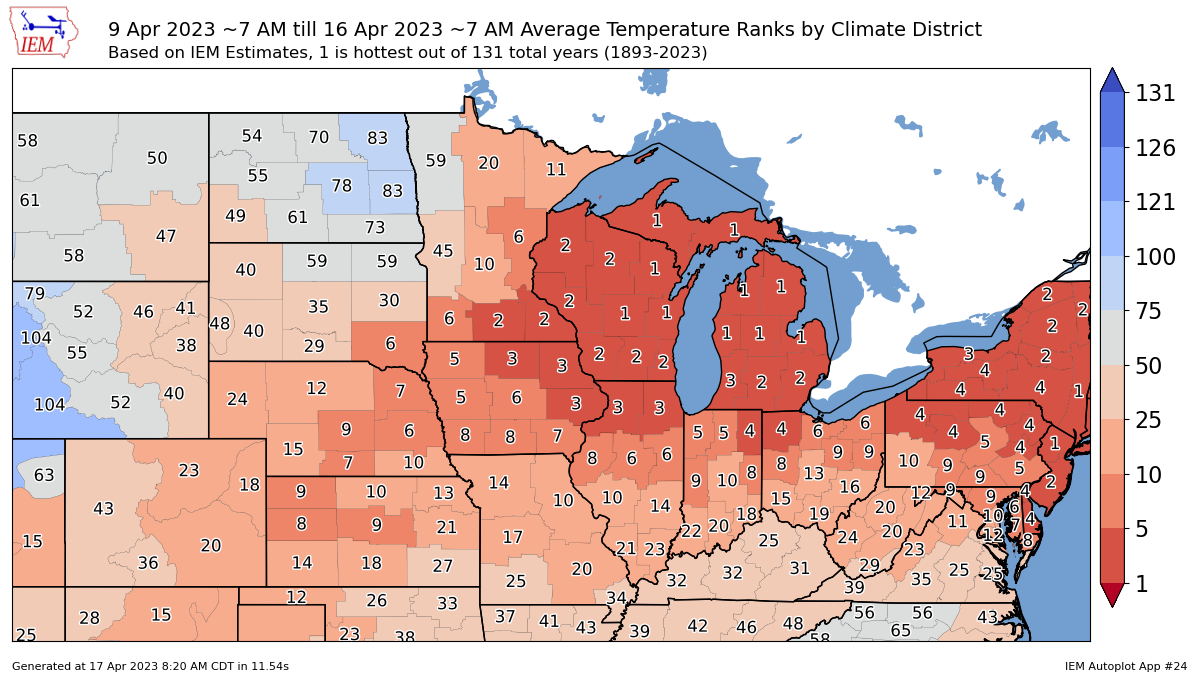
Winning lotto numbers...not bad considering is occurred between April 10 and the 17th.  Look at these temperature ranking during the period. 


We came off of a highly variable March. No long stretches of warmth. A nine day stretch with below normal temps in the middle of the month. 


Why the pattern become consistently warmer?

The answer lies in the MJO (Madden Julian Oscillation). We need to look at the tropical Pacific. 

The MJO (read about it here) moves in varying magnitudes from west to east along the equator.  Here is a nice animation.  Green is more cloud cover. Brown colors are less cloud cover.  Notice how the northern Pacific jet stream fluctuates as the MJO moves through different phases (1 to 8).


Here is cross section of what is occurring.


How does something that is on the other side of the earth impact our weather?

Notice the temperatures in early March when the MJO was in a super-strong phase 8-1, slightly warmer than normal than it moved into a cooler phase (2 & 3) which connects with the cooler than normal mid March.  MJO then spun back around to phase 7-8-1 (lower magnitude) which connected to the 70s and 80s we had last week. The MJO impacts are different depending on the season.  You'll notice the MJO in similar phases (April 17 to 30 forecast but weaker) to early the March phase (stronger).  This looks to connect with a cooler next 7-10 days across the eastern 2/3 of the US.


There are always many drivers at work impacting the weather pattern. The MJO was just one of many influencing our weather with summer like temperatures last week.


Friday, April 07, 2023

Cleveland Baseball Opening Day Weather History

I checked the temperature for every "opening day" since 1871 when the professional baseball team was called the Cleveland Forest Citys.  Listed here are the warmest and coldest at each major ballpark.


Cleveland professional baseball started in 1869 with the first professional game played near the present day E. 38th street in between Scoville and Central Avenues in 1871 at a park called the National Association Grounds which is near the current Ensign Avenue and. E 55th. The team was named the Cleveland Forest Citys after the Forest City Coffee Company. They lost 25-6 to the first professional baseball team the Cincinnati Red Stockings.

Location of the Cleveland Forest Citys Park in 1871


Since that year, professional baseball in Cleveland faded in and out of existence as it did in other cities back then. In 1871 and 1872, a Cleveland team also names the Forest Citys was formed but disbanded. Then from 1879 to 1884, the Cleveland Blues played their games at the Kennard Street Park. During that stretch, they won 4 of the 6 opening days. In 1885 and 1886, no professional baseball was played in Cleveland. But in 1887, Cleveland baseball returned again. Named the Spiders, they won 10 of the next 13 opening days through the 1899 season. Cleveland baseball was played at many locations between 1871 and the present. 

Locations of Cleveland baseball parks since 1871

In 1900, no Cleveland baseball existed because of the ineptitude of the 1899 Cleveland team which had a record of 20-132, still the worst record of any baseball franchise in baseball history. The team subsequently folded.

Starting in 1901, the new American Leagued was formed and Cleveland baseball was born again. Since then, Cleveland baseball has been played in 3 stadiums (League Park, Cleveland Stadium and now Progressive Field)

More than 50% of opening days featured temperatures above 60 degrees. Most of these occurred in the early 20th century when the season was shorter and started later (late April/early May).


Picture from Opening Day in 2007.  Game was postponed and moved to Milwaukee due to snow.


Thursday, February 02, 2023

How Does The Christmas 2022 Blizzard Compared to the January 1978 Blizzard?


Just last week we remembered the Blizzard of 1978 or the White Hurricane as it would be known as after the fact. Ohio turnpike was shutdown gate to gate.  Twenty foot high snowdrifts. Wind gusts above 80 mph in spots across Ohio and beyond.  If you lived during the storm, the memories will live forever.

A blizzard is defined as three hours of sustained winds of 35+ mph, 1/4 mi or lower visibility due to blowing and/or falling snow.  The last condition is key as you don't need falling snow for a blizzard to occur.  Recently the Blizzard of Christmas 2022 created conditions that in some respects rival the '78 blizzard.  Below is a comparison between the initial 12 hour period for each blizzard. The data includes precipitation type, temperature, wind chill, wind direction, speed and gusts followed by air pressure from Cleveland Hopkins Airport:


A few elements stand out here.  You'll notice the wind chill values of the 1978 storm are greatly reduced compared to what many publications sited years ago. The wind chill calculation changed in 2001 to reflect new science on the subject of heat loss on the body.  Earlier estimates put the wind chill at under -60° but in reality, the chills probably bottomed out at -30°,  maybe -40° with the higher gusts with the new formula.  Other notable findings from the observations above:

* The temperature drop during the December 2022 storm was greater (42° to 0° in 8 hours).  The 1978 storm had a sharper drop. 43° to 9° in 5 hours.

* 2022 storm created wind gusts nearing 50 mph at Hopkins with some reports above 60 mph once the temperatures dropped into the single digits.  These wind gusts (50+ mph) took roughly 5-7 hours to reach after peak temperatures. The 1978 storm had gusts reaching 70+ within 3 hours of peak temperatures

* Official wind chill values were LOWER during the 2002 storm.

* 1978 storm was far deeper with lowest air pressure at 958 mB vs 993.0 mB with the 2022 storm.

* Snow depth was much deeper in 1978.  16" before the storm versus no snow on the ground at the start of the 2022 storm.

What about the conditions after the initial 12 hours?  Here are the hourly observations for each storm over the next 48 hours. 2022 storm on left.  1978 storm on right. Color coding is identical to the image above.


Here are some notable findings in these 48 hours

2022 storm:

* Temperatures remained below zero for another 12 hours and under 10 degrees for another 19 hours.

* Sustained wind speeds stayed at 30 mph for 12 hours with gusts near 40 mph for 24 hours.

* Wind chills remained at under -20° for 24 another hours.

The progression of the arctic cold was fast and widespread. After 7 days the extreme cold had faded.

7 day temperatures vs normal during and following blizzard

1978 storm:

* Temperatures never dropped below zero; remained below 10 degrees for only 9 hours

* Sustained winds were similar to the 2022 storm (30 mph for 12 hours) with 40+ gusts 

Wind chills stayed between -5° and -15° as temps stayed between 5° and 15° degrees


The cold following the '78 blizzard was just as harsh and quick but it lingered much longer.

7 day temperatures vs normal during and following Blizzard

The surface features with both storms look very similar.

January 1978 Blizzard

December 2022 Blizzard


Psychology tells us that our experiences especially during extreme events tend to leave a stronger mark in our mind more than more benign events.  The January 2022 blizzard was one of those events.  The blizzard around Christmas 2022 was also a memorable one--certainly not the worst in northern Ohio history but it's on the list (maybe top 5)--and should be remembered in the same breath as the '78 storm.

Friday, January 13, 2023

Above/Normal Winter Temperatures in Cleveland: Is there a Trend?

How often have we heard the saying "Perception is Reality"?  

No other phrase describes the weather better than this one. We look at past winters through our own personal lens molded by our own experiences in that weather. Maybe we were on our way to a Christmas party in a snow storm similar to this past Christmas blizzard. Perhaps it was a really warm Christmas like 2019 or 1982.  Maybe it was a severe thunderstorm that caused damage to your house.  Events like this leave an indelible mark in our minds placing more weight on these weather events versus others. Psychology tells us that we typically remember these extremes more than the averages.  Perception is indeed reality. 

Below are the total number of days where the average temperature was above normal and below normal for Cleveland, Ohio (NWS station at Hopkins Airport).  I looked at every winter since 1960-61 (December through February) using the SC ACIS site.  All normals are calculated using the period 1991-2020.


DJF Days Above Normal


DJF Days Below Normal

If we just plot the higher end above normal days (at least +10 degrees above normal) this is what we find:

DJF Days at least 10 degrees ABOVE NORMAL

Now the lower end below normal days (at least -10 degrees below normal):