Many wonder why I write so much about the psychology of weather. If you read the comments on most of my posts over the years you'll see why. Many will believe what they want to believe. They use social media as a conduit to say whatever impulsive thoughts they want without recourse science be damned. Bias and perception become the ultimate reality.
I use social media and my blog--since 2005--to show why weather events occur the way they do. I post statistics, records and graphical charts about past weather to show some perspective. I think I'm successful most times. Unfortunately a significantly large percentage of the social media audience are not receptive much to my dismay.
So rather than use technical, long winded science to explain the why we do what we do, I'm taking a straight forward approach (with some dry humor and sarcasm) to drive home some points:
1) It WILL snow at some point between February and early April. It always does.
2) The warm weather in winter plays with our minds. Our weather perceptions (cognitive biases) are very strong. We are not immune. We are all human. Recognition of these preconceived notions is the first step in an objective understanding the weather and the science that governs it. Public perception is very powerful.
3) We humans hate forecast uncertainty. Heck, we all hate uncertainty of any kind really. Here's why LINK
4) Contrary to what you might believe, weather forecasts are more accurate than they were 15 years ago. According to this study, "the accuracy of the 8-10 day forecast today are similar to a 5-7 day forecast 15 years ago. Hurricane accuracy is greatly improved since Hurricane Katrina LINK.
4a) Many people say that TV weather forecasts were better/more local/more accurate in the 1970s or 1980s. Totally disagree. Look one up on Youtube. Those forecasts look pretty antiquated.
4) Our morning show here at FOX 8 in Cleveland is 6 hours (4am to 10am). I have 41 weather segments, headlines and teases. I will repeat myself. The weather forecast between 4 and 10am can change as the conditions change. Forecasts are not frozen in time during each weather segment. The weather doesn't stop for television.
5) The decision to break into a popular TV show or sporting event with a weather update is NOT an impulsive one. Stations have different philosophies on when to break into programming. I can't speak for the others. However, my station WJW-FOX 8 only breaks during a tornado warning or a significant winter weather event (widespread, blizzard-like snow which doesn't happen every year). We treat those weather events very seriously especially when people's lives are threatened.
6) Most television weather maps typically show the weather in two dimensions which by their nature don't paint a complete picture. Imagine the atmosphere (especially during sleet, freezing rain events) like layers of a wedding cake. Each layer of icing represents the different layers of air at different temperatures with different types of precipitation.
Note: The wedding cake analogy is mine and mine alone. I invented it :)
8) In reality, the atmosphere is a three dimensional, ever changing fluid. Complex equations are used in describing its behavior. Many television meteorologists took classes in thermodynamics, cloud physics, years of calculus and differential equations. Its not as easy as looking out the window https://journals.ametsoc.org/doi/10.1175/MWR-D-17-0257.1
7) Moon or sun halos are not uncommon. They are beautiful sights caused by the bending, splitting and reflecting of sunlight through ice crystal clouds. Double rainbows are super common. We have hundreds of photos from viewers. Call me when you see a tertiary rainbow!
8) I grade my long range outlooks. (I've added the extreme temperatures category) Here is an example from the winter of 2018-19.

8) I'm not a fan of phone weather apps that promise super-local weather forecasts for your backyard every 15 minutes. They are like unicorns. They truly don't exist as promised. Most phone app forecasts are created from computer generated model data that's approximated based on your location via your phone's GPS. I will always trust a human generated forecast app (via NWS or your local tv station like FOX 8) every day of the week. Also, a radar app is a must for everyone.
9) Jet contrails are not chem-trails. They, like unicorns, don't exist. I don't like conspiracy theories.
10) I have no control of weather, news or school closing promos that run many times per hour. The promotions department is on the first floor.
11) Yes, pre-Christmas warmth is unusual but its happened before. Remember 1982? Remember 2019?

12) Simply because the weather has been warm or cold in your area, wet or dry doesn't confirm or deny climate change. It's more complicated than that. It never fails. People on social media will invariably post evidence--usually what they observe in their backyard over time--confirming their preconceived notions. See number 2 above for the reasons why. There are many reputable sites and sources on Climate Change.
14) I consider myself an operational meteorologist who happens to be on television. I constantly read research papers, articles on new forecasting techniques and other weather posts from other meteorologists so that I can incorporate these new developments/forecasting techniques into my on-air segments. The science has come a long way.
13) We forget that the 2000s was the snowiest decade in northern Ohio NOT the 1970s

14) The term Polar Vortex is not new. Yes, it's real (LINK)
15) "Panhandle Hooks" in winter typically feature wetter snows from the southwest. Please don't call it a "Panhandle Hooker".
16) Contrary to what we believe, you cannot use one or two days or even a weeks worth of weather as a predictor of the season ahead. For example, a warm or cold December is not an indicator of the spring or summer ahead. A super wet spring/early summer (2019 for example) doesn't mean the rest of the summer will be wet/little heat. Basically the drivers of winter or any season aren't necessarily the drivers of next season. It's not an apples to apples comparison. I wish it was. (Remember December 2014 was warmer than normal. Then the bottom fell out: January through February in Cleveland was the 6th coldest on record, coldest since 1978)
17) Seasonal forecasts are like grandma's casserole. There are many ingredients. You change one ingredient and, just like the taste of grandma's casserole, the outlook will be totally different.
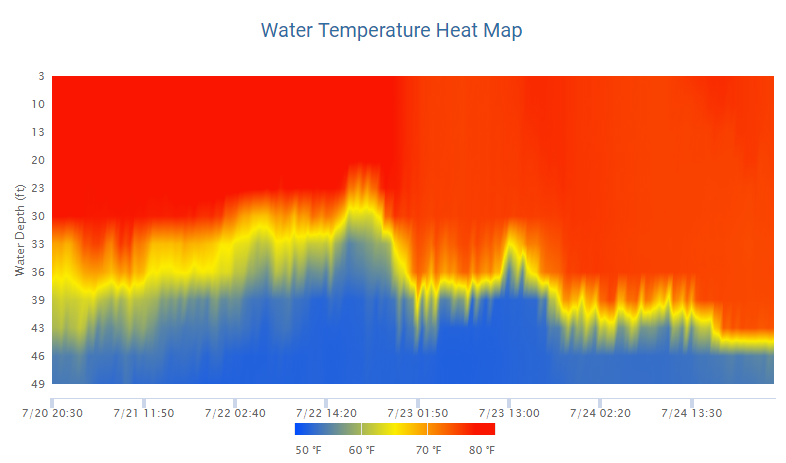
18) The Lake Erie water temperature is taken at a depth of 30 feet near the water intake a few miles offshore. There are also satellite measurements taken each day which are available FREE online.
19) There is a TON of science behind seasonal outlooks. The Farmers' Almanac is not science (although I enjoy reading it). Weather consulting companies issue seasonal outlooks tailored for their clients. This is a multi-million dollar enterprise and it continues to grow significantly.
20) Many readers will ignore everything I typed here and replace it with their own conclusions regardless of their validity.
I reserve the right to add to this list.
I hope this helps :)

So rather than use technical, long winded science to explain the why we do what we do, I'm taking a straight forward approach (with some dry humor and sarcasm) to drive home some points:
*******************
1) It WILL snow at some point between February and early April. It always does.
2) The warm weather in winter plays with our minds. Our weather perceptions (cognitive biases) are very strong. We are not immune. We are all human. Recognition of these preconceived notions is the first step in an objective understanding the weather and the science that governs it. Public perception is very powerful.
3) We humans hate forecast uncertainty. Heck, we all hate uncertainty of any kind really. Here's why LINK
4) Contrary to what you might believe, weather forecasts are more accurate than they were 15 years ago. According to this study, "the accuracy of the 8-10 day forecast today are similar to a 5-7 day forecast 15 years ago. Hurricane accuracy is greatly improved since Hurricane Katrina LINK.
4a) Many people say that TV weather forecasts were better/more local/more accurate in the 1970s or 1980s. Totally disagree. Look one up on Youtube. Those forecasts look pretty antiquated.
4) Our morning show here at FOX 8 in Cleveland is 6 hours (4am to 10am). I have 41 weather segments, headlines and teases. I will repeat myself. The weather forecast between 4 and 10am can change as the conditions change. Forecasts are not frozen in time during each weather segment. The weather doesn't stop for television.
5) The decision to break into a popular TV show or sporting event with a weather update is NOT an impulsive one. Stations have different philosophies on when to break into programming. I can't speak for the others. However, my station WJW-FOX 8 only breaks during a tornado warning or a significant winter weather event (widespread, blizzard-like snow which doesn't happen every year). We treat those weather events very seriously especially when people's lives are threatened.
6) Most television weather maps typically show the weather in two dimensions which by their nature don't paint a complete picture. Imagine the atmosphere (especially during sleet, freezing rain events) like layers of a wedding cake. Each layer of icing represents the different layers of air at different temperatures with different types of precipitation.
Note: The wedding cake analogy is mine and mine alone. I invented it :)
8) In reality, the atmosphere is a three dimensional, ever changing fluid. Complex equations are used in describing its behavior. Many television meteorologists took classes in thermodynamics, cloud physics, years of calculus and differential equations. Its not as easy as looking out the window https://journals.ametsoc.org/doi/10.1175/MWR-D-17-0257.1
7) Moon or sun halos are not uncommon. They are beautiful sights caused by the bending, splitting and reflecting of sunlight through ice crystal clouds. Double rainbows are super common. We have hundreds of photos from viewers. Call me when you see a tertiary rainbow!
8) I grade my long range outlooks. (I've added the extreme temperatures category) Here is an example from the winter of 2018-19.

8) I'm not a fan of phone weather apps that promise super-local weather forecasts for your backyard every 15 minutes. They are like unicorns. They truly don't exist as promised. Most phone app forecasts are created from computer generated model data that's approximated based on your location via your phone's GPS. I will always trust a human generated forecast app (via NWS or your local tv station like FOX 8) every day of the week. Also, a radar app is a must for everyone.
9) Jet contrails are not chem-trails. They, like unicorns, don't exist. I don't like conspiracy theories.
10) I have no control of weather, news or school closing promos that run many times per hour. The promotions department is on the first floor.
11) Yes, pre-Christmas warmth is unusual but its happened before. Remember 1982? Remember 2019?

12) Simply because the weather has been warm or cold in your area, wet or dry doesn't confirm or deny climate change. It's more complicated than that. It never fails. People on social media will invariably post evidence--usually what they observe in their backyard over time--confirming their preconceived notions. See number 2 above for the reasons why. There are many reputable sites and sources on Climate Change.
14) I consider myself an operational meteorologist who happens to be on television. I constantly read research papers, articles on new forecasting techniques and other weather posts from other meteorologists so that I can incorporate these new developments/forecasting techniques into my on-air segments. The science has come a long way.

14) The term Polar Vortex is not new. Yes, it's real (LINK)
15) "Panhandle Hooks" in winter typically feature wetter snows from the southwest. Please don't call it a "Panhandle Hooker".
16) Contrary to what we believe, you cannot use one or two days or even a weeks worth of weather as a predictor of the season ahead. For example, a warm or cold December is not an indicator of the spring or summer ahead. A super wet spring/early summer (2019 for example) doesn't mean the rest of the summer will be wet/little heat. Basically the drivers of winter or any season aren't necessarily the drivers of next season. It's not an apples to apples comparison. I wish it was. (Remember December 2014 was warmer than normal. Then the bottom fell out: January through February in Cleveland was the 6th coldest on record, coldest since 1978)
17) Seasonal forecasts are like grandma's casserole. There are many ingredients. You change one ingredient and, just like the taste of grandma's casserole, the outlook will be totally different.
18) The Lake Erie water temperature is taken at a depth of 30 feet near the water intake a few miles offshore. There are also satellite measurements taken each day which are available FREE online.
19) There is a TON of science behind seasonal outlooks. The Farmers' Almanac is not science (although I enjoy reading it). Weather consulting companies issue seasonal outlooks tailored for their clients. This is a multi-million dollar enterprise and it continues to grow significantly.
20) Many readers will ignore everything I typed here and replace it with their own conclusions regardless of their validity.
I reserve the right to add to this list.
I hope this helps :)