Showing posts with label lake erie water temperature. Show all posts

Friday, June 13, 2025

What's With The Cool Lake Erie Water?


Check out this chart. It shows the water temperatures off Cleveland for each year since 1995 from May 1 to June 15. I dimmed out every year except last year (2024) and this year for easier reference.


Note that last year's water temperature in May was close to the warmest on record. This year, the temperatures were below normal. Lake Erie water temperature responds to the air temperature.  Notice how last year the temperatures around the Great Lakes were well above normal in May.  This year, below normal.

May 2024 Temperatures VS Normal


May 2025 Temperatures VS Normal

Given the pattern for the remainder of June through mid July, the Lake Erie water temperature will rebound nicely!


Tuesday, December 17, 2024

What Happened to the "Warm" Lake Erie?


It was only a little over 3 weeks ago (November 18) when Lake Erie was the warmest ever at this point in November. Satellite water temperatures go back to the mid 1990s. This was undoubtedly in response to the very warm early November.

The warmth started in October across the central US and Great Lakes.

When you look at just the first 3 weeks of November the warmest expanded and intensified.

November 14 through the 19th warmth continued to move into the Midwest.

Once we moved past Thanksgiving, the overall pattern became dominantly colder across areas that were breaking record high temperatures. Here is the progression of the cold from central Canada starting in late November. Each image is a 10 day period. First image starts November 19th.


The first half of December has been below normal overall across much of the Great Lakes even after the core of the cold retreated back north.

The graph below illustrates the Lake Erie water temperature each year (1995 through 2024) starting on November 28 and ending December 17. Notice how this year was the warmest 3 weeks ago. Look how the Lake Erie water temperatures responded to the below normal temperatures. Compared to the last 30 years, the water temperature now is near average. A huge drop of roughly 10 degrees in almost 3 weeks!


Given the 2-3 day period of cold this weekend then the warmer pattern between Christmas and New Years, the water temperature drop will probably slow.  Look at the new Canadian long range model output for early January. Ridge development near Greenland, Gulf of Alaska/Aleutian island low shifts west. Ridge/warmth over the central US shifts west. Trough/cold settles into the Great Lakes/eastern US the first week of January. (This setup was highlighted on the the FOX 8 Morning Newscast December 9). If this verifies, Lake Erie water temperature will continue to drop. Good bet we will have some ice coverage by the second week of January.


Thursday, July 25, 2019

What Caused the Lake Erie Water Temperature Changes Recently?

A huge upwelling event occurred along the eastern shoreline of Lake Michigan earlier this week. Water temperatures dropped from the lower 70s to the upper 40s in under 24 hours! Why did this happen? The Grand Rapids, Michigan National Weather Service office has a great graphic that describes what upwelling is.


Can this occur along the Lake Erie shoreline here in Ohio? Absolutely. In fact, some significant temperature changes occurred about 24 hours after the Lake Michigan event just offshore near Cleveland.

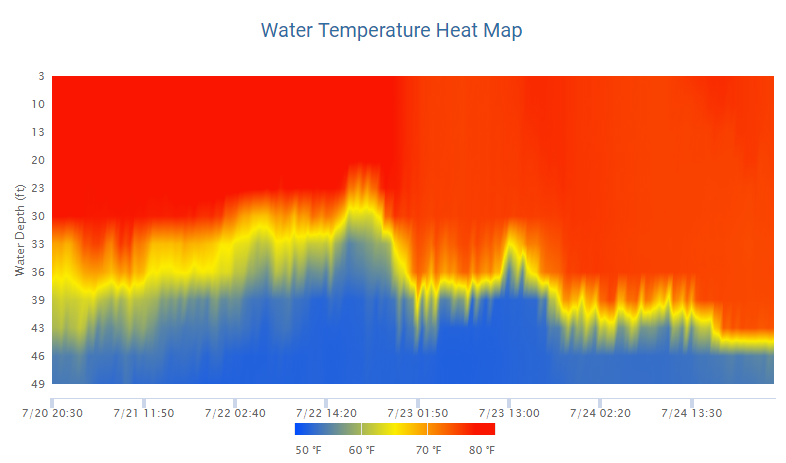
I created a basic animation showing how the water temperatures fluctuated earlier this week especially as depths between 20 and 40 feet. One short-lived drop of around 10 degrees at 23 feet, steadier drops at 30 feet with a spike of more than 20 degrees at 30 feet. At 40 feet, water temps rose from 52 to 75 degrees in under 24 hours. Below that depth, water temperatures have been consistently near 50-55 degrees.


Lake Erie water temperature colorized depth map shows the variation under the surface


A sustained north wind developed Tuesday and Wednesday...


Wave heights had a big spike as the north wind took over.


North wind and higher wave heights match up with the drop in temperature.


Thankfully the bulk of the colder water didn't make it all the way to the surface. Temperatures went from 79 to 73 degrees at this buoy. Temperatures stabilized over the next 24 hours

Bottom line is never under estimate the influence the north wind has on Lake Erie conditions. The higher waves are the changes we see on the surface. The rough conditions under the surface either through strong rip currents or temperatures drops to levels that can cause hypothermia are not as obvious and lesser known.


Thursday, November 10, 2016

How Do Current Lake Erie Water Temperatures Compare to Other Warm Years? More Snow?

Lake Erie ice cover from 2011

After the warmest period from June 1st to October 31st on record at the official NWS reporting station at Hopkins Airport, the Lake Erie water temperature is above any of the most recent years with the exception of 2005. 


Average Lake Erie water temperature on November 1, 2005 was 15° Celsius. 
This year: 14.8°C. As of this writing (November 10), the average water temperature is still well above normal at 14.5°C or about 58 degrees F.

This is 5 degrees warmer than the closest years--2007 and 2005!


Each year regardless of the air temperature, the water temperatures dropped significantly to between 0°C and 5°C.

How will this affect lake effect snow?  If a decent shot of arctic air slides across the lake before the water temperatures fall around the first of the year, any lake effect snowfall could be significant.

I wrote several post a FEW YEARS AGO about the subject of Lake Effect snow.

Here are the ingredients for Lake Effect:

1. Temperature difference between the lake and the air aloft (5000 feet) has to be at least 13 degrees celsius. The more, the better.

2. Abundant atmospheric moisture independent of the lake

3. Wind speed

4. Wind direction

5. Fetch Length (How far does the wind blow over the lake)

6. Instability and instability depth (Usually driven by a cold front/trough and/or the lake temperature difference) Deeper the instability, the deeper the snow growth

7. Orographic lift (elevation differences between Cleveland and the snowbelt. 1200 feet in portions of Geauga county)

Even if #1, 3, 4, 5 and 6 are present (the most common variables), subtract any one of these variables especially 2 and 5--sometimes 7 if the wind direction shifts) and snowfall forecasts can turn out much different than anticipated. 

Will we see one of these 3 "flavors" of lake effect snow dominate this winter?  More on this next month.


Sunday, April 17, 2016

Lake Erie Water Temp vs 1998


The water temperature is still at dangerously cold levels. The lake water temperature lags behind the land temperatures a good 60-80 days in spring. Daytime temperatures in the suburbs can reach mid 60s or 70s yet the lake will stay very cold.  Water temperatures usually don't rise into the 60s until early June. Please, be very careful around the lake over the next two months.

We just came off of a big El Nino winter.  Milder temperatures with below normal snowfall. (we can very close to getting dumped on several times with large snowfalls. Those storms headed into New England). Will the lake water temperatures mirror the spring/summer of 1998, the end of the last big El Nino winter?

This graph show the water temperature in mid April as of this writing on the left.  The right box shows all of the Great Lakes during 1998 (after the last major El Nino).


The water temperature is already slightly above the 25 year average and in line with the April 1998 levels. Assuming we don't have significant runoff from heavy rainfall this spring through mid June along with average to slightly above normal temperatures, water temperatures should stay slightly above normal this summer if your heading to Edgewater or Cedar Point!

Here are the Lake Erie water temperatures in spring of 1998 with 30 year average in parentheses:

May 1:    52  (47)
May 15:  54  (52)
June 1:    64  (57)
June 15:  67  (62)
July 1:     71  (68)
July 15:   77  (72)(
July 21-23:  79 (Highest)  (73 on the 22nd)
August 1:    77  (74)
August 15:   77  (74)
September 1:   77  (73)
September 15:   73 (71)
September 30:   71  (67)