Tuesday, December 07, 2021

December Warmth is Coming. So When Did We Know?


For several years, I've been implementing a variety of research in creating long range outlooks for the Ohio Valley and Great Lakes on the 18-21 days time scale. In fact last year, almost a year to the day, I issued a long range December outlook using the same techniques highlighting a panhandle snow track on the 8th  (Outlook was dead on. The percentage was too low)   CLICK HERE FOR THE POST 

One of the variables I use is daily changes in the Southern Oscillation Index (SOI).

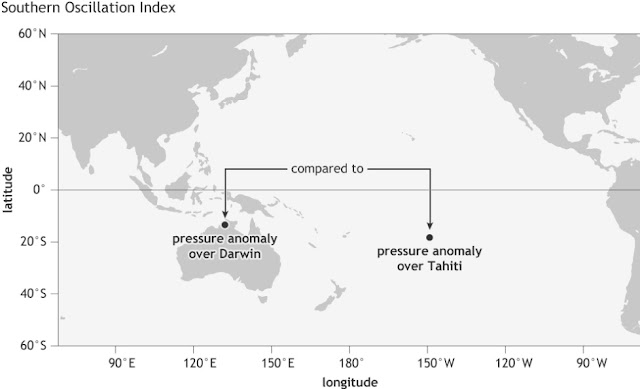
The SOI is the different in pressure between Darwin, Australia and Tahiti.

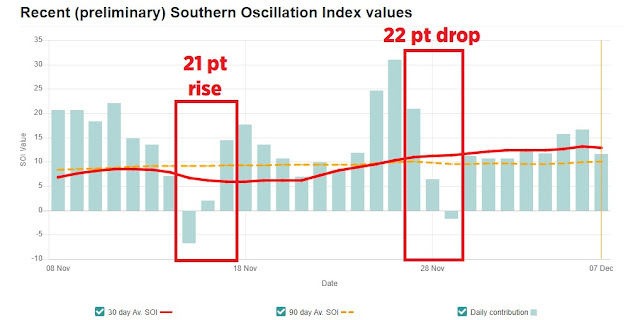
Look at the daily SOI values since early November.  Notice the period where the SOI rose near 20 points over a 2 day period and a drop of more than 20 points. First period was Nov 15-17, the second was Nov 14-16.


The sharper the change (rise or drop) the greater the effects in other parts of the world. Meteorologist Joe Renken was instrumental in doing the research showing what these changes mean 2-3 weeks days in the future across North America in different seasons and different ENSO states (El Nino, Nada or La Nina).  You can read the paper HERE. 

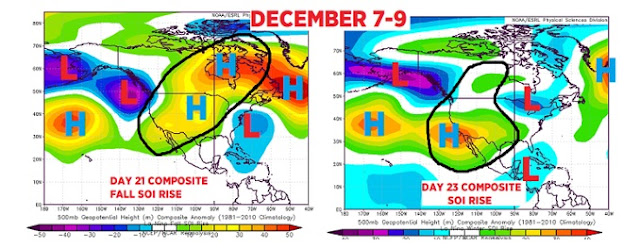
The first sharp SOI rises above yielded these upper level composites in similar seasons/conditions. Notice the ridge in the central US and the lingering Great Lakes/Eastern US low pressure.  I posted this a week before Thanksgiving. The seeds were for the December warmth were planted here.

SOI composite: Day 21 & 23 ahead

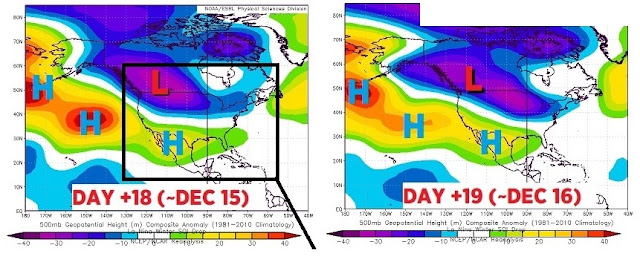
The SOI drop (right red box above) gave us these composites.


You can see the high pressure/warmth across the southern states.  What's also apparent is the lingering low pressure from the British Columbia coast east along the US/Canadian border and into the Great Lakes. A big indicator that Clipper Systems and short-lived intrusions of cold will interrupt the warmth. We have already seen this up & down pattern in reality thus far since Thanksgiving.  Remember that this pattern was indicated in late November.

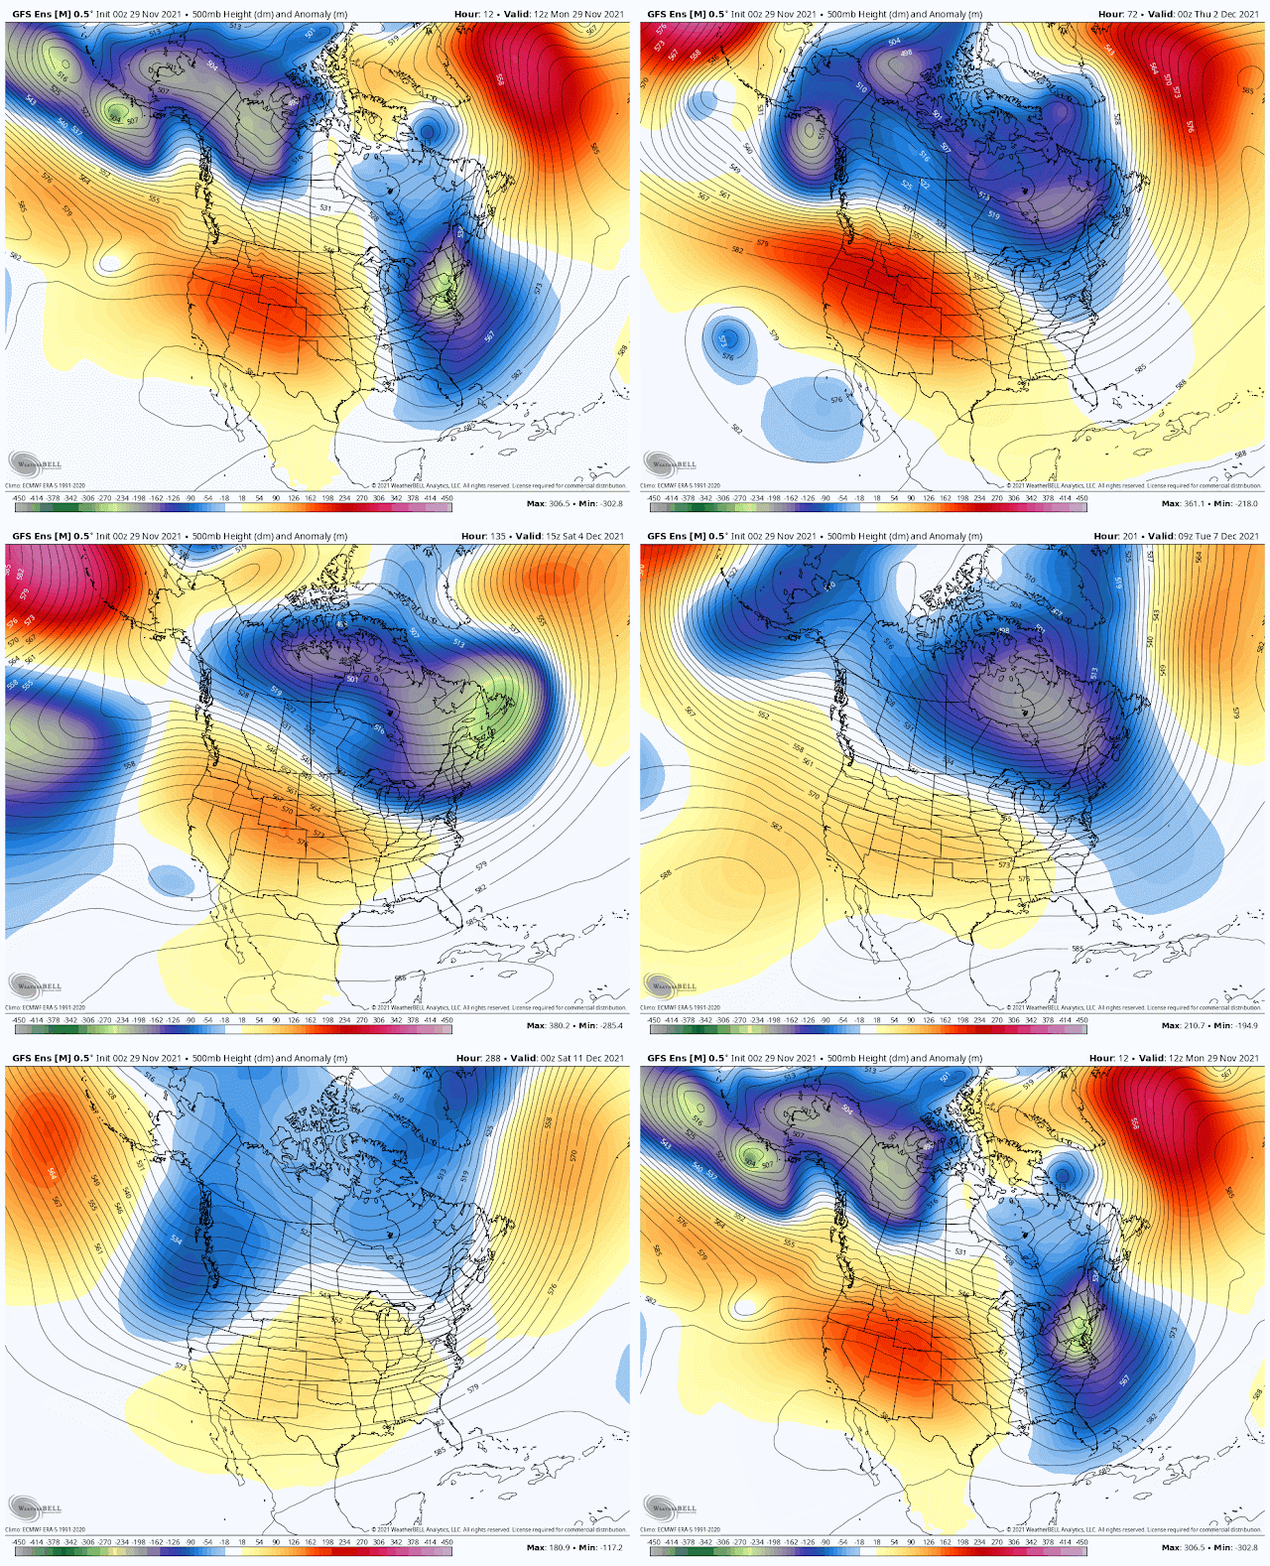
The actual computer model output (GFS) on November 29 mirrored the composites!


So what did all of this SOI analysis before Thanksgiving tell us about the mid-December outlook?  It tells us that above normal temperatures were coming. We'd have brief interruptions of cold with local snow from time to time before the longer lasting period of "warmth" around the middle of the month. As of this writing (December 7) I still think we will see a 60 with sun BEFORE Christmas week!

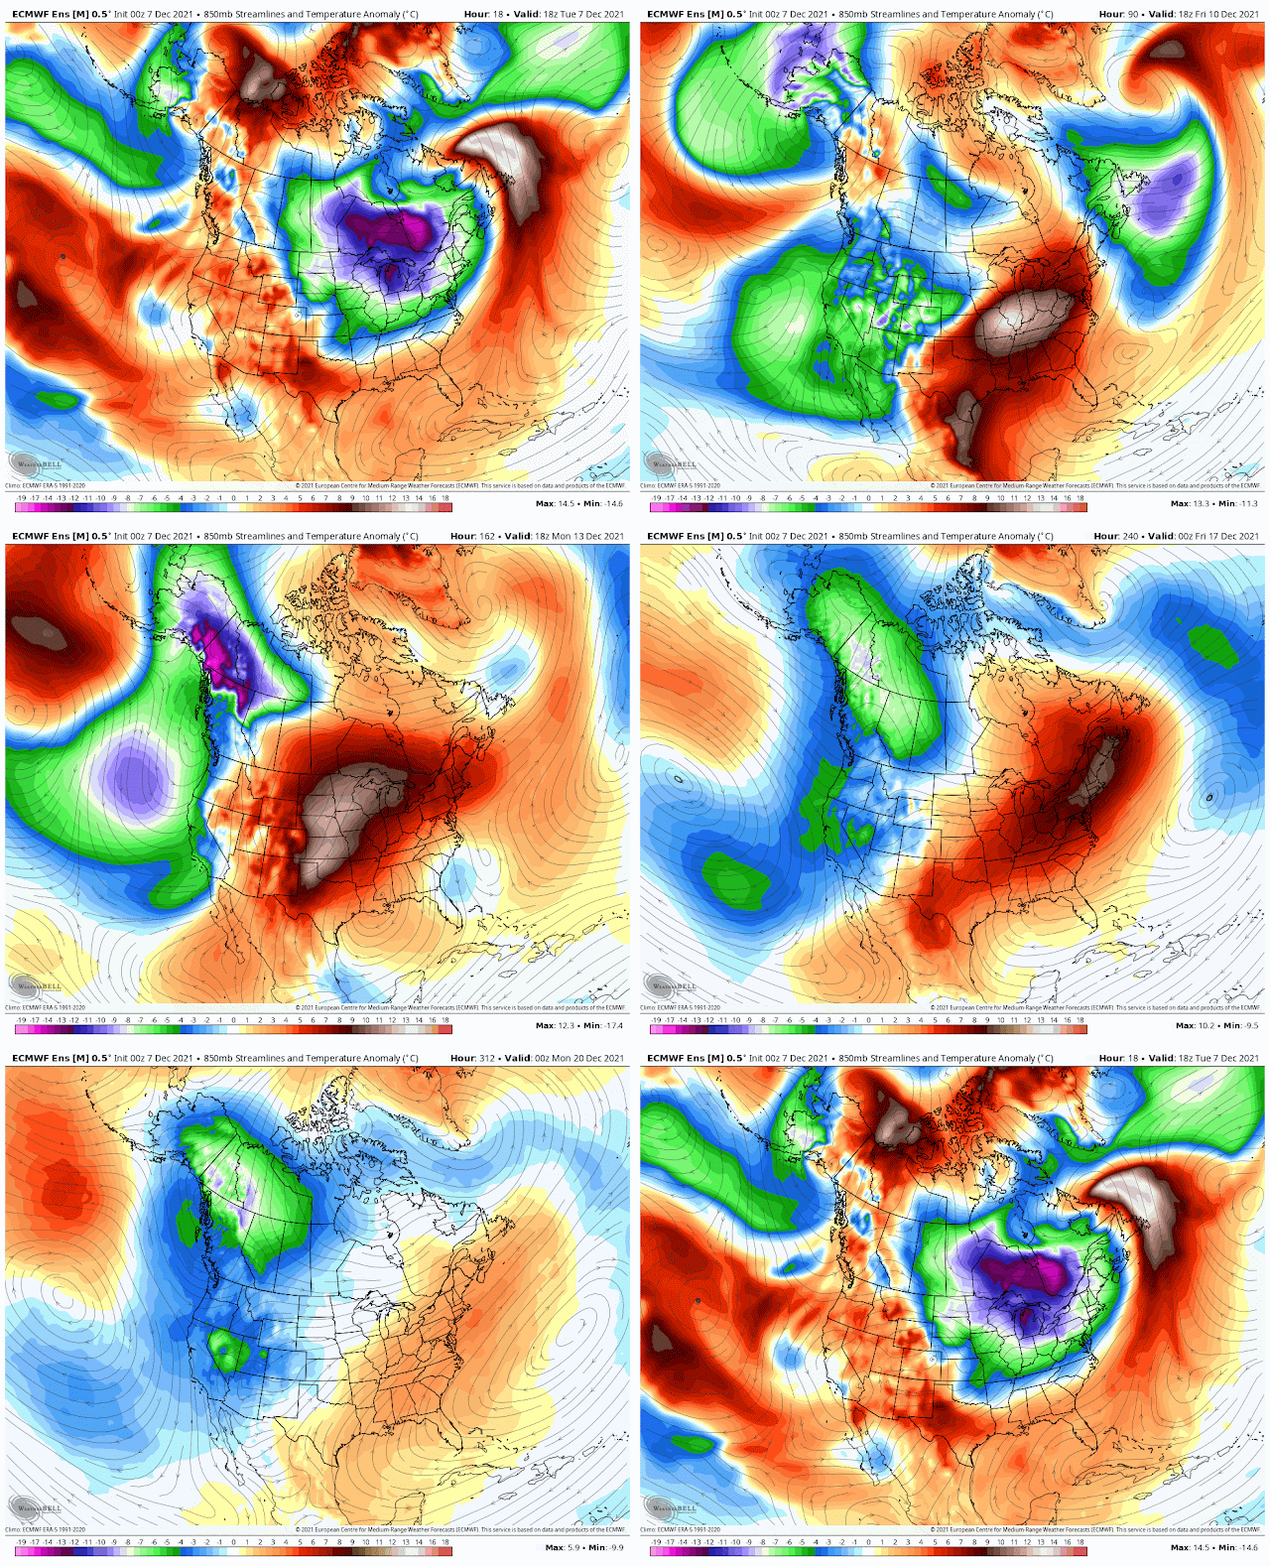
The current model output (December 7th) shows the warmth finally popping across the eastern US. Loop is from Dec 7 to December 22.  

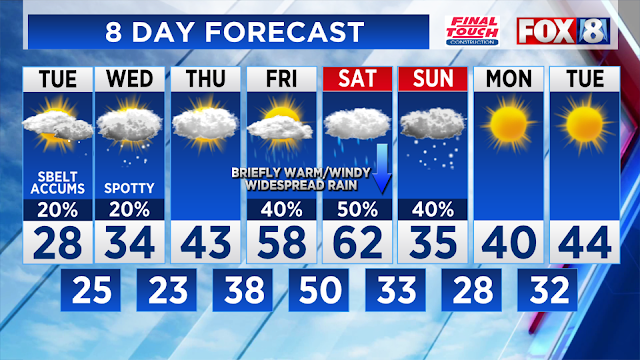
Our northern Ohio 8 day forecast illustrates the up and downs.


Note that the SOI was only one of several other variables (not mentioned here) were used in creating the mid December outlook. 

Who says we can't predict the weather 20 days in advance!

Any questions send me an email:  scott.sabol@fox8.com

Thursday, December 02, 2021

November 2021 Recap: Where Did The Temperatures End Up?


After a super warm October around most of the country, November featured more periods of "cold" across the eastern US.

First the October temperatures vs average


Now the November temperatures vs average (US)


Breaking down November into weekly periods you can see how variable the temperatures were as the split jet stream shifted week to week.  First week was colder than normal (lower left) across eastern US. The cold backed off the second week as the jet weakened as it lifted back into central Canada (upper right)


Third week featured the return of the northern jet across the northern states (upper left below) with colder periods more frequent (lower left).  By November 16-18, southern jet became stronger with a more uniform northern jet more southeast. The result was warmer temps out west with more sustained colder temps eastern US (lower right)


A close up look at the northern US/Great Lakes shows the sharp contrast between temperature regimes.

Max temperatures & Minimum temperatures vs average. 


So far most of the lake effect communities across the Great Lakes have had slightly above normal snowfall.

Overall snowfall across the US is below last year


Next post we'll take a look at what December is looking like!


Tuesday, November 09, 2021

Welcome Changes to Flood Watch/Warnings - NWS

In an effort to simplify the communication of weather information, the National Weather Service has now consolidated all types of FLOOD WATCHES AND WARNINGS.  This will help the public significantly.


Friday, November 05, 2021

Will This Warmth Give Way To More Cold By Thanksgiving Week?

The pattern is looking more favorable for cold as the east coast trough becomes deeper and much wider.  Here is the GFS model showing the trough developing then reloading by the 20th of November.


Northern Pacific pattern is very progressive.  Lows sliding out of eastern Asia, across the dateline, the Aleutian Islands and into the Gulf of Alaska before they dive into the northern US. 


I hesitate showing a snowfall map like this but it tells the GENERAL story:  Bursts of cold.  Fast moving systems.  Warmer than normal Great Lakes.  All of this points to a good possibility for snow at some point the week of November 15-20...maybe deeper into the month.  How much actually sticks is the big question. 

Historically one day 3 inch snows occur mostly between 23 and 33 degrees


Historical November snowfall 


Friday, October 29, 2021

How Did Last Winter Compare to Other Recent Winters?

One of the first snow blowers

The COMPLETE WINTER SCORECARD going back to winter 2004-05!    

If you would like another metric added to this list, send me a note:

scott.sabol@fox8.com


December through February temperatures relative to 20 year average versus DJF snowfall for each winter season since 1940.  I highlighted some notable years for reference.


Monday, October 25, 2021

Northern Ohio Tornado Outbreak Recap

Late October into November is considered a second severe weather season across the eastern US. Storm systems get stronger, deeper and more frequent as the jet stream strengthens. Large temperature variations over the central US, Great Lakes and Ohio Valley are increasing as cold fronts start to bring down colder air.

October tornado touchdowns by county and NWS coverage area


Notice how the tornado touchdowns shift further east in November.


Multiple tornado warnings were issued by NWS Cleveland late Thursday afternoon.  The map below shows the tornado warnings superimposed with tornado confirmations. As of this map creation the Lake county tornado was not confirmed. Ultimately a tornado was confirmed in Wickliffe yet no tornado warning was issued. 


There were 7 confirmed tornadoes Thursday, October 21 across northern Ohio.


Radar loop from Thursday October 21, 2021 - 


Rating:                 EF1
Estimated Peak Wind:    97 mph
Path Length /statute/:  0.1751 miles
Path Width /maximum/:   50.0 yards
Fatalities:             0
Injuries:               0

Start Date:             10/21/2021
Start Time:             04:49 PM EDT
Start Location:         1 E Wickliffe / Lake County / OH
Start Lat/Lon:          41.6079 / -81.4525

End Date:               10/21/2021
End Time:               04:50 PM EDT
End Location:           1 ENE Wickliffe / Lake County / OH


Rating:                 EF0
Estimated Peak Wind:    80 mph
Path Length /statute/:  0.781 miles
Path Width /maximum/:   25.0 yards
Fatalities:             0
Injuries:               0

Start Date:             10/21/2021
Start Time:             05:08 PM EDT
Start Location:         2 N Hudson / Summit County / OH
Start Lat/Lon:          41.2686 / -81.4409

End Date:               10/21/2021
End Time:               05:11 PM EDT
End Location:           2 NNE Hudson / Summit County / OH

Rating:                 EF1
Estimated Peak Wind:    110 mph
Path Length /statute/:  2.9615 miles
Path Width /maximum/:   50.0 yards
Fatalities:             0
Injuries:               0

Start Date:             10/21/2021
Start Time:             05:10 PM EDT
Start Location:         3 NW Hills And Dales / Stark County / OH
Start Lat/Lon:          40.8632 / -81.4877

End Date:               10/21/2021
End Time:               05:15 PM EDT
End Location:           2 WSW North Canton / Stark County / OH
Rating:                 EF1
Estimated Peak Wind:    104 mph
Path Length /statute/:  0.6582 miles
Path Width /maximum/:   50.0 yards
Fatalities:             0
Injuries:               0

Start Date:             10/21/2021
Start Time:             06:15 PM EDT
Start Location:         3 NNW Cortland / Trumbull County / OH
Start Lat/Lon:          41.3796 / -80.736

End Date:               10/21/2021
End Time:               06:18 PM EDT
End Location:           3 N Cortland / Trumbull County / OH

Rating:                 EF0

Estimated Peak Wind:    80 mph

Path Length /statute/:  0.0772 miles

Path Width /maximum/:   20.0 yards

Fatalities:             0     Injuries:               0

Start Date:             10/21/2021;  Start Time:             06:20 PM EDT

Start Location:         5 NNE Cortland / Trumbull County / OH

Start Lat/Lon:          41.3865 / -80.6642

End Date:       10/21/2021;  End Time:   06:21 PM EDT: End Location: 5 NNE Cortland / Trumbull County / OH

Thursday, October 14, 2021

How Unusual is this Unseasonably Warm October?


The entire Ohio Valley, Great Lakes, portions of the upper midwest and Northeast have enjoyed warm temperatures which rank #1 all-time through October 13th!


The above normal warmth extends into much of Canada with below normal temperatures along the west coast

HUGE high pressure ridge responsible for the warmth.  Look at the lows tracking across the deep south.  Keep an eye on this feature later this fall and into the winter (hmmmmm)

High temperatures in northern Ohio have been above normal all month.  Only one other October has had every day through the 15th above normal--2017.


The pattern can't sustain itself like this forever.  Overall pattern is starting to show signs of heading back to "normal". This was my long range outlook hinting at a "cooler" late October issued on October 5th


As of this writing (October 14th) the overall pattern is showing cooler periods with some "bump ups" in temperature; nothing long lasting.

Watch the warmer colors (high pressure) become smaller to be replaces by troughs (blue colors) to finish out the month. Basically temperatures will be averaging out to near average for late October.