Showing posts with label 2023. Show all posts

Friday, August 25, 2023

Historic August Rainfall/Severe Weather Recap

The clean up continues after the second round of heavy rain/severe storms across northern Ohio.

17 school districts closed due to damage and power outages:

Here is the COMPLETE radar loop from August 23 at noon through early August 25 before sunrise. Warnings, watches and lightning are included for northern Ohio.


I separated the 2 day rain event into 3 separate radar loops starting at 9pm August 24 through August 25 at 3am:

August 23 - 12:30PM through August 24 - 5AM

August 24 - 5AM through August 24 9AM


August - 9PM through August 25 - 5AM

Historic rainfall over 48 hours with two separate large clusters of rain/storms:


Another vantage point shows the heaviest rain from southern Michigan through Ohio and western PA.


Since August 1, most of northern Ohio has received 200-400% of normal rainfall:


Severe storm warnings were widespread. Most of northern Ohio was under a severe thunderstorm warning at some point between August 23 and early August 25.


4 tornado warnings. 12 tornadoes. COMPLETE NWS RECAP


The EF-1 that occurred on the east side of Cleveland was the first tornado that occurred within the Cleveland city limits since July 12, 1992 per NWS Cleveland. That tornado occurred near Hopkins Airport.

Here are ALL of the tornadoes from 1950 to 2022 in Cuyahoga County


Why did this heavy rain occur?  What were the factors that lead to this?


The huge ridge of heat in the central US has been a fixture for at least a week. 


Where high pressure resides, low pressure has to follow either down or up stream. Disturbances rode up and over the ridge and down through the Great Lakes.  

Great lakes radar loop from Wednesday through Friday: The excessive heat watches/warnings are shown in red.


Couple this with the high humidity (dewpoints above 75) and you have the recipe for heavy rainfall.


Interestingly, the historic Derecho in 1969 on the 4th of July produced MORE rainfall!


Here are the final rainfall numbers between August 23-25 using the same perspective as the 1969 map above (for comparison)


Oh and almost 75,000 lightning strokes over the 48 hour period across Ohio!


Friday, May 12, 2023

How Does The Weak Cleveland Guardians Offense Compare to Past Years?


How does this year's offense rank?  How does it compare to each season since 2015 through May 10th?


The fact that they are only 3 games below .500 is a testament to their pitching especially relief pitching. Their ability to score runs has been near or at the bottom of the league across the board. The only season close to this season was 2019.  All data below is through May 10th since 2015.

(RISP = Runners in scoring position)


Cleveland Guardians record as of May 11th:  (thru 37 games)

2023:  17 -20

2022:   17 - 20

2021:   21 -16

2019:   20 - 17

2018:   18 - 19

2017:    20 -17

2016:    20 - 17

2015:    14 - 23

Wednesday, January 18, 2023

Lake Erie Ice Cover Update


High resolution image of Lake Erie, January 16,2023

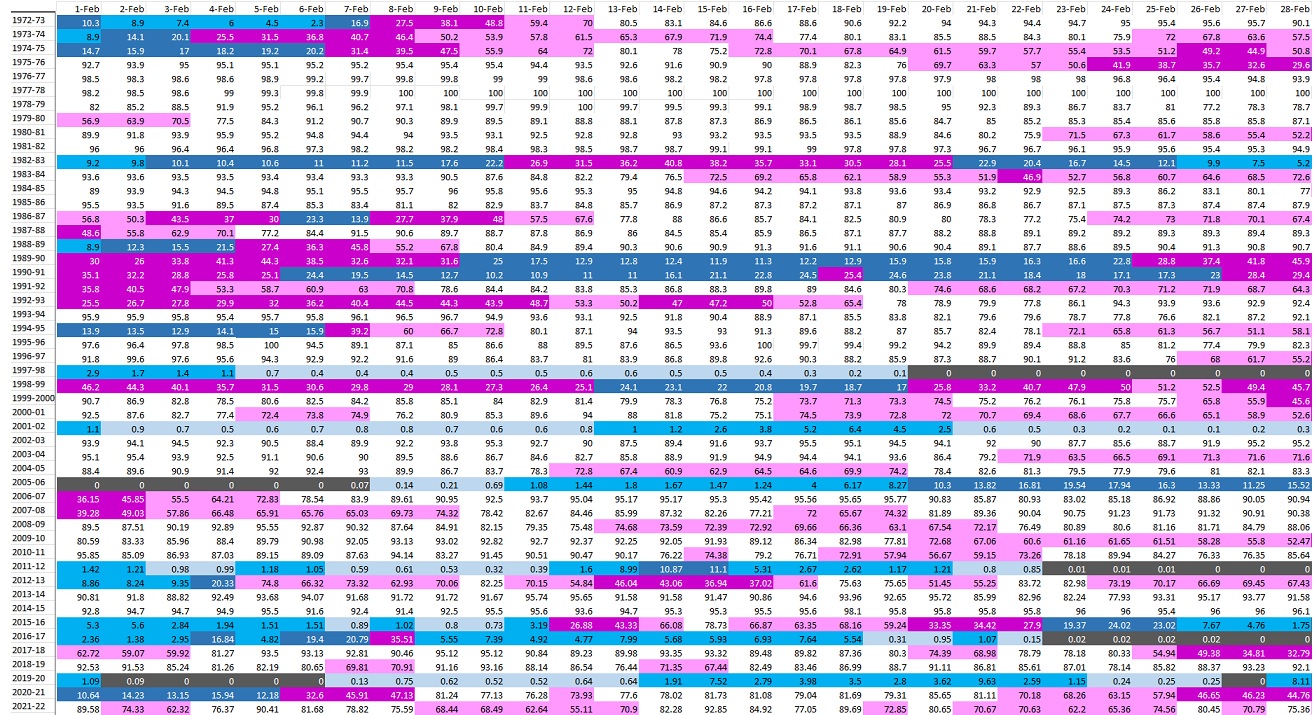
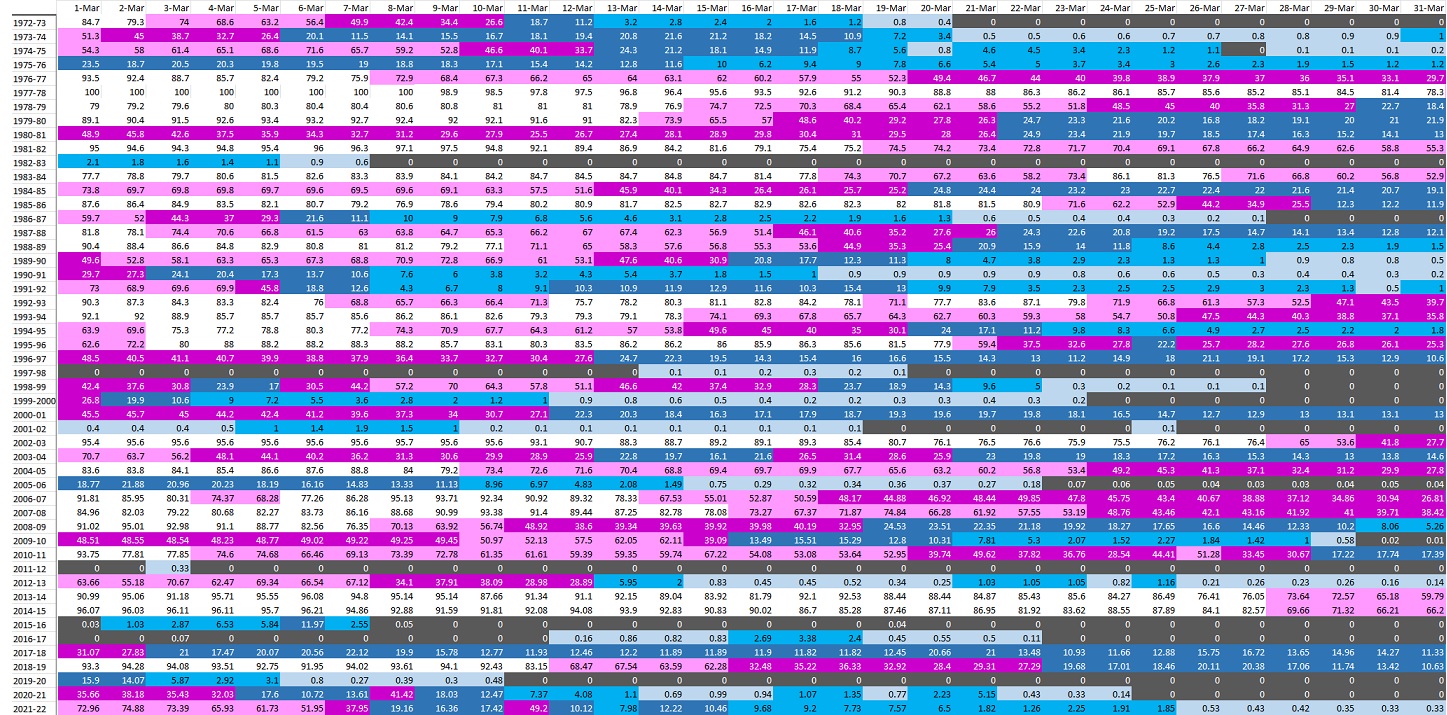
I finally updated the daily Lake Erie ice coverage charts for each season since 1972. I separated this into month periods starting with November and ending with May.  This is all color coded. 

  • Light blue blocks indicates ice coverage under 1%
  • Bright blue is 2% to 10%
  • Dark Blue is 11% to 25%
  • Purple is 26% to 50%
  • Pink is 51% to 74%
  • White indicates at least 75% coverage

You'll notice several things here:
  1. Significant ice typically doesn't develop until late December.
  2. Mid/late 1970s AND the early 2000s stand out as the most significant ice coverage period in  January and early Februar
  3. First half of February is typically the peak for ice coverage
  4. November 23, 2014 was the earliest ice cover
  5. May 17, 1982 was the latest ice cover 

Back in 2021 and 2022, I did some research on the conditions needed for rapid ice development.  Links are  HERE  and  HERE


NOVEMBER


DECEMBER


JANUARY


FEBRUARY


MARCH

APRIL


MAY
Number of days with ice coverage 90% or higher:


Number of days with ice coverage 10% or higher (since 2010-11)


All Lake Erie ice data from THIS SITE BACK TO 1972

Graph comparing this year (2022-23) to years past

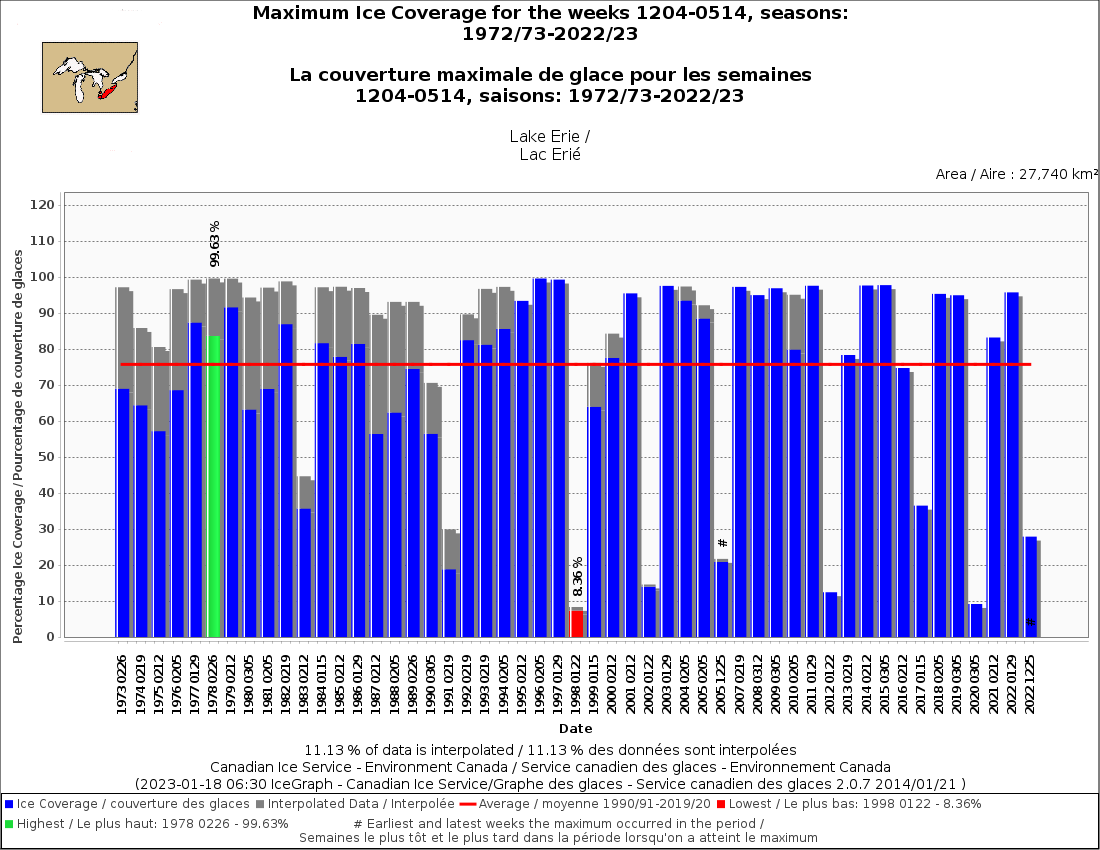
Canadian ice service for more historical perspective


Max ice coverage each winter