Showing posts with label Summer. Show all posts

Wednesday, July 02, 2025

Early Rainfall Comparison: 2025 vs 2024


Total rainfall for northern Ohio from May 15 through July 1 in 2024:

Shades of light blue/dark blue and red/pink are areas with rainfall above 6 inches

*  Only 0.6% of northern Ohio has received 10"+ of rain since May 1st.

              2024:  Total volume of rain water:  1,160,000,000,000 trillion gallons


Total rainfall for northern Ohio from May 15 through July 1 this year:

Almost the entire area has received more than 6 inches of rain!

*  19% of northern Ohio has received at least 10"+ of rain since May 1!

2025: Total volume of rain water:  2,290,000,000,000 trillion gallons


Take home summary:  From May 15 to July 1, northern Ohio has received 67% more rainfall this year vs last year!

Friday, August 25, 2023

Historic August Rainfall/Severe Weather Recap

The clean up continues after the second round of heavy rain/severe storms across northern Ohio.

17 school districts closed due to damage and power outages:

Here is the COMPLETE radar loop from August 23 at noon through early August 25 before sunrise. Warnings, watches and lightning are included for northern Ohio.


I separated the 2 day rain event into 3 separate radar loops starting at 9pm August 24 through August 25 at 3am:

August 23 - 12:30PM through August 24 - 5AM

August 24 - 5AM through August 24 9AM


August - 9PM through August 25 - 5AM

Historic rainfall over 48 hours with two separate large clusters of rain/storms:


Another vantage point shows the heaviest rain from southern Michigan through Ohio and western PA.


Since August 1, most of northern Ohio has received 200-400% of normal rainfall:


Severe storm warnings were widespread. Most of northern Ohio was under a severe thunderstorm warning at some point between August 23 and early August 25.


4 tornado warnings. 12 tornadoes. COMPLETE NWS RECAP


The EF-1 that occurred on the east side of Cleveland was the first tornado that occurred within the Cleveland city limits since July 12, 1992 per NWS Cleveland. That tornado occurred near Hopkins Airport.

Here are ALL of the tornadoes from 1950 to 2022 in Cuyahoga County


Why did this heavy rain occur?  What were the factors that lead to this?


The huge ridge of heat in the central US has been a fixture for at least a week. 


Where high pressure resides, low pressure has to follow either down or up stream. Disturbances rode up and over the ridge and down through the Great Lakes.  

Great lakes radar loop from Wednesday through Friday: The excessive heat watches/warnings are shown in red.


Couple this with the high humidity (dewpoints above 75) and you have the recipe for heavy rainfall.


Interestingly, the historic Derecho in 1969 on the 4th of July produced MORE rainfall!


Here are the final rainfall numbers between August 23-25 using the same perspective as the 1969 map above (for comparison)


Oh and almost 75,000 lightning strokes over the 48 hour period across Ohio!


Tuesday, July 05, 2022

Are Summers Becoming More Consistently Humid/Less Breaks?


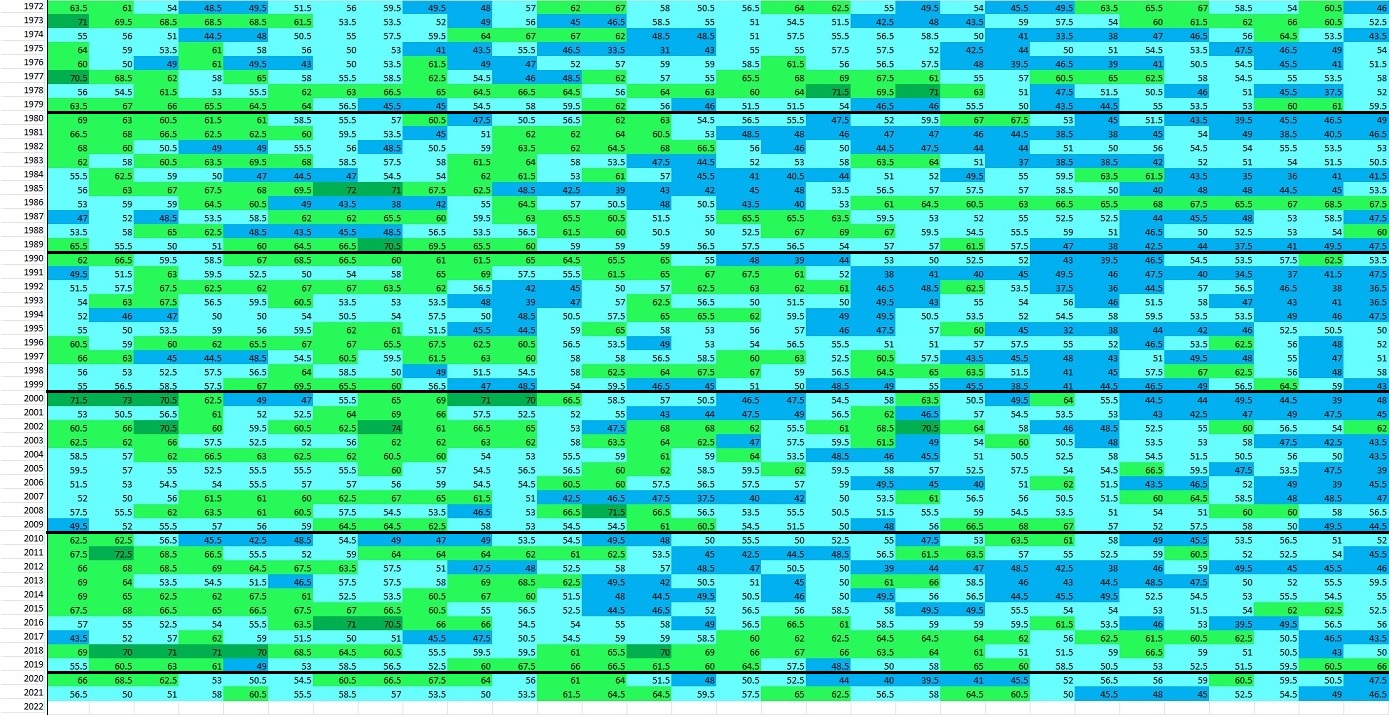
The plots below are the average dew point for each day from June 1 to September 30 since 1972 for Cleveland. I color coded each dew point range for easy reference.

Dark Blue: 30-49°

Light Blue:  50-59°

Light Green:  60-69°

Dark Green:  70-80°

First image is the month of June. Reading left to right for day one through 30. Horizontal black line separates each decade. I notice more breaks from high humidity days in the 1970s and 1980s. More consistently high humidity in the mid/late 1990s into the early 2000s. Recently, lower humidity days seem more frequent in the first half of the month


Second image is July. Over the last 10-15 years the frequency of "lower humidity" days (light blue) seems less than previous decades.


Third image is August


Fourth image is September:


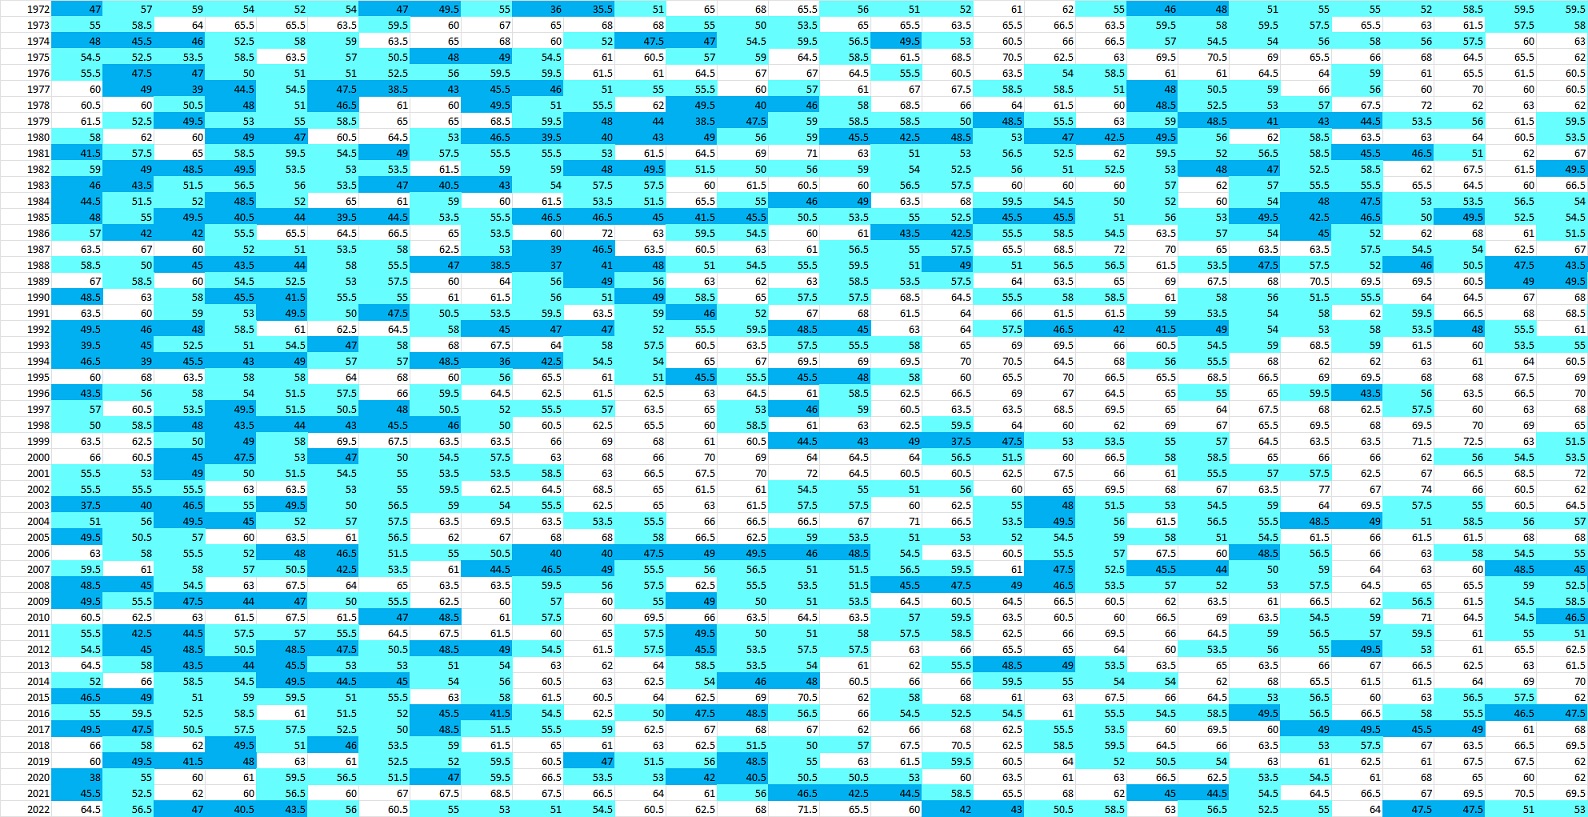
Let's only display the days with dewpoints UNDER 60.  Basically more comfortable days. Now we can see the frequency of delightful days for each summer month/day.  Some quick observations:

* Breaks in the humid days in June look to be more frequent in the 1970s/80s and early 2000s
* Breaks in humid days in July more frequent in the 1970s, early 80s and early 2000s.
* Breaks in humid days in August more frequent in the 1970s.
* Breaks in humid days in early September more frequent in 1970s and 1980s

JUNE DEWPOINTS SINCE 1972 (UNDER 60)


JULY DEWPOINTS SINCE 1972 (UNDER 60)


AUGUST DEWPOINTS SINCE 1972 (UNDER 60)


SEPTEMBER DEWPOINTS SINCE 1972 (UNDER 60)

Monday, June 06, 2022

How Humid was Last Summer? A Look At This Summer


Last August I wrote about the summer humidity at that point in the summer (You can read about it HERE). So I figured I'd revisit the topic now with last summer's final ranking.

It turns out that SUMMER 2021 was the 4th most humid summer since 1948 followed by 2010 at #3, 2018 at #2.  What summer is #1?  1995


Was last summer (2021) ranked #4 because we had an abnormally high number of days with dewpoints in the 70s?  Probably not. The next graphic shows the number of hours for each year we reached a dewpoint of 70+.  

There were 21 other years with more than 2021!  So what was special about the humidity last summer?  It was consistently humid with very little breaks.  

The number of hours with a dewpoint BELOW a dewpoint of 60 really tells the story.  Only 5 years had fewer hours with dewpoints under 60!  1973, 1987, 1995, 2010 & 2018.   Basically last summer we had far fewer breaks.


Our summer outlook for 2022 highlighted a slow start to summer.  So far as of this writing (June 6) the number of hours with dewpoints above 70 is ZERO!  


Last summer at the end of June we had 71 total hours so we have a long way to go to catch up to last year.  Remember it's early


Wednesday, July 01, 2020

How Often Does July Feature Above Normal Temperatures? July 2020 Outlook

Here is a look at the average OVERALL temperatures for each July for Cleveland over the last 50 years. RED circles indicate years that were above normal by at least 1 degree.

Let's add BLUE circles to indicate years below normal.


How about the number of days with ABOVE NORMAL high temperatures?
Last year we had more than average.  Yet from 2013-2015 above normal high temperatures in July were way down.

Bottom line:  July isn't always consistently hot historically like many of us believe.


So what is July 2020 looking like?

The position of the ridge of high pressure in the central US will dictate how hot we get in the Ohio Valley. This animation shows the ridge expanding after July 8th.


We'll be on the eastern edge of this heat ridge. This will more than likely allow some NW to SE moving storms to develop early next week and again mid-month...


Analog composites show this too. Something to watch.


Bottom line July Outlook:

Temperatures: Above normal (25 of the 31 days above normal)
Rainfall: Well below normal


Thursday, June 14, 2018

Heat Index Levels: Last 10 Years (Cleveland, Ohio) and Others

This weekend will feature our first days with heat indices in the mid to upper 90s this year. Some have surmised that our weather has been more humid than in recent years.  Here are plots showing the number of hours the heat index reached at least 80 degrees. BLUE denotes current year. RED is the average for each period.

Drought year of 1988:  36 days above 90 degrees