Showing posts with label lake effect snow. Show all posts

Monday, March 03, 2025

US and Great Lakes Snowfall Recap Thus Far


Snowfall across northern Ohio started out impressive in late November. More than 60"+ inches of snow fell in parts of the snowbelt. The most in parts of eastern Lake and the northern 2/3rds of Ashtabula county since the record setting lake effect event in November of 1996.


Photo: NWS Cleveland


Snow across northern Ohio and the Great Lakes started out with a bang in November and December. Here are some great images from Meteorologist Ben Noll showing snowfall vs normal by November 22 around the Great Lakes and nationally.


Snowfall vs Normal through November 22


After the big snow at the end of the month, snowfall recovered fast. Blue and Purple areas indicated WELL ABOVE seasonal snow.


Nationally through December 10:


Here is the snowfall vs normal map through December 18th:


Now snowfall vs normal through January 1st.  Notice how the departures began to drop around the Great Lakes snowbelt areas. Below normal snowfall the latter half of December.  The November snow kept the overall seasonal totals above normal.


National snowfall numbers also started to drop.

The snowfall decline accelerated in January. The snowbelts still had spots with seasonal snow above normal driven by the late November snows. Snowfall was well below normal since January. Much of the interior regions were running well below normal snowfall by early February.


The middle of the US, upper mid-west and most of the Ohio Valley was well below normal by early February.

By March 1st, the seasonal snow across the Great Lakes was almost back to normal. Snowbelt of northern Ohio, PA and western New York only slightly above due to the late November snowfall.


Seasonal snowfall across the US east of the Rocky Mountains through March 1 is characterized like this:


  • Well below normal snowfall in the central US, upper mid-west, Ohio Valley including Pennsylvania, New Jersey and parts of New England.
  • Slightly above normal snowfall in the Great Lakes snowbelts due to early season snow. Below normal snowfall since January 1st.
  • Above normal snowfall in the south from southern Missouri, Arkansas, Kentucky and Tennessee.
  • Above normal snowfall along the gulf coast due to the late January record snowfall:


Ohio and Pennsylvania snow depth animation from November 20 through March 3:

My next post will dive into northern Ohio snowfall further comparing this year to years similar


Thursday, December 19, 2024

How Often Do Conditions Develop To Produce Lake Effect Snow?


One of the many variables to produce lake effect snow is a significant enough difference between the water temperature and the temperature 5000 feet off the ground. Typically you need a difference of at least 13 degrees Celsius. So if the water temperatures is say 50 degrees F (10 Celsius) and the air temperature at 5000 feet is 27 degrees (-3 Celsius) that would be the lowest difference to allow evaporation and eventually the condensation of water vapor to occur as the colder air moves over the warmer lake.  The greater the difference, the faster the air rises and the more unstable the lake effect snow becomes.


This satellite image shows the uniform bands of lake effect cloud cover off every Great Lakes with a strong northwest wind. Notice the lack of cloud cover on the windward (western) side of each lake. The condensation of the water vapor occurs more than 20 miles offshore as the warm water vapor rises into the colder air aloft. 


How often does a difference of 13 degrees Celsius occur in northern Ohio in the prime lake effect snow time of the year?

I cross referenced the Lake Erie water temperature and the temperature at 5000 feet for five straight winters (Nov 2014 through January 2019). Each instance where the difference meets of exceeds 13 degrees Celsius I shaded that day in blue.


We average about four instances where the Lake Erie/5000 foot temperature difference exceeded 13 degrees (high enough for lake effect snow) each winter between 2014 and 2019.  How many of these produced significant snow?  More on that later.


Monday, December 09, 2024

FINAL snow totals from Thanksgiving Weekend Lake Effect Event


Ashtabula County...

  1 NNE Saybrook         63.2"

  1 NNE Geneva           50.5" 

  2 ESE Monroe Center    45.2"    

  Edgewood               42.3"    

  2 S Ashtabula          40.0"   

  3 E South Madison      37.8"  

  3 S Kingsville         34.0"   

  4 SE Harpersfield      26.3"   

  3 ENE Trumbull         25.0"   

  3 NNE Andover           9.0"   

  1 E Orwell              7.4"   

  2 NNW Cherry Valley     4.0"


Cuyahoga County...

  2 NE Euclid             9.0"   

  1 SSE Mayfield          5.0"   

  1 NNE Richmond Heigh    2.6"   

  1 ENE Lyndhurst         2.6"   

  Pepper Pike             1.1"   

  1 WSW Shaker Heights    0.7"   

  2 SW Cleveland Heigh    0.1"   

  Middleburg Heights        T   


Geauga County...

  4 S Madison            33.0"   

  2 ESE South Thompson   22.6"   

  1 S Montville          14.7"   

  Chardon                 9.5"   

  3 SW Chardon            9.4"   

  2 ENE Russell Center    3.8"   

  3 WSW Auburn Corners    2.6"   


Hancock County...

  1 SSW Findlay           0.5"   


Lake County...

  North Madison          45.0"   

  3 W South Madison      40.0"   

  2 WSW North Madison    36.1"   

  2 WNW Concord          34.1"   

  1 SSE Mentor           29.2"   

  2 ESE Perry            27.8"   

  Mentor-on-the-Lake     25.3"   

  3 N Willoughby         24.0"   

  2 SSW Mentor-On-the-Lake   24.0"   

  2 S Waite Hill         20.8"      

  1 W Eastlake           15.9"    

  Willoughby             13.0"   


Lorain County...

  3 SE Elyria               T   


Lucas County...

  3 N Holland             0.1"   

  1 ESE Neapolis            T   


Mahoning County...

  2 ESE Austintown        0.9"  

  Canfield                0.7"   


Morrow County...

  Mount Gilead              T   


Portage County...

  Hiram                   2.0"   

  2 W Ravenna             0.5"   


Richland County...

  1 W Mansfield           0.2"   


Seneca County...

  4 S Old Fort              T   


Stark County...

  2 ENE Canton            0.5"   


Summit County...

  1 W Barberton           3.0"   

  1 NW Tallmadge          0.7"   

  3 N Portage Lakes         T   


Trumbull County...

  Cortland                2.7"   

  1 WNW Newton Falls      1.2"   


Wayne County...

  2 ESE Doylestown        0.2"   


Wood County...

   2 NW Tontogany         0.6"   


Photos Courtesy NWS Cleveland:


Thursday, November 10, 2016

How Do Current Lake Erie Water Temperatures Compare to Other Warm Years? More Snow?

Lake Erie ice cover from 2011

After the warmest period from June 1st to October 31st on record at the official NWS reporting station at Hopkins Airport, the Lake Erie water temperature is above any of the most recent years with the exception of 2005. 


Average Lake Erie water temperature on November 1, 2005 was 15° Celsius. 
This year: 14.8°C. As of this writing (November 10), the average water temperature is still well above normal at 14.5°C or about 58 degrees F.

This is 5 degrees warmer than the closest years--2007 and 2005!


Each year regardless of the air temperature, the water temperatures dropped significantly to between 0°C and 5°C.

How will this affect lake effect snow?  If a decent shot of arctic air slides across the lake before the water temperatures fall around the first of the year, any lake effect snowfall could be significant.

I wrote several post a FEW YEARS AGO about the subject of Lake Effect snow.

Here are the ingredients for Lake Effect:

1. Temperature difference between the lake and the air aloft (5000 feet) has to be at least 13 degrees celsius. The more, the better.

2. Abundant atmospheric moisture independent of the lake

3. Wind speed

4. Wind direction

5. Fetch Length (How far does the wind blow over the lake)

6. Instability and instability depth (Usually driven by a cold front/trough and/or the lake temperature difference) Deeper the instability, the deeper the snow growth

7. Orographic lift (elevation differences between Cleveland and the snowbelt. 1200 feet in portions of Geauga county)

Even if #1, 3, 4, 5 and 6 are present (the most common variables), subtract any one of these variables especially 2 and 5--sometimes 7 if the wind direction shifts) and snowfall forecasts can turn out much different than anticipated. 

Will we see one of these 3 "flavors" of lake effect snow dominate this winter?  More on this next month.


Tuesday, April 05, 2016

How Historic Is This April Cold? April Snow?

There is little sign that this cold April will end anytime soon.  The cold air this weekend will be similar to last weekend. In fact, the 850mB (5000 ft) temps over Lake Erie, the key component for determining lake effect snow amounts, might crack the top 5 coldest ever for the month of April since 1950!   Here is the list per the NWS

 Both the GFS and the European show pretty much the same amount of cold as of this writing.

The pattern shows some signs of moderation across the eastern US but not until at least the midway point of the month. Another wave of colder air will follow this weekend's cold by the middle of next week.


The lack of snowfall this winter is almost historic. So far, our season snow total is the lowest since the winter of 1931-32.


April snowfall of at least one inch happens roughly 50% of the time. Here is a look at the percentage of seasonal snowfall in April.  This past weekend's snowfall brings this year's percentage up to 5%. Expect snow chances to climb with each burst of colder air through the middle of the month.


Wednesday, February 10, 2016

Saturday, January 03, 2015

Current Radar Loops - Freezing Rain, Steady Rain, Arctic Air

Spotty freezing (rain that hits the ground and freezes on untreated surfaces) will be mixed in with general rain this morning. The transition to all rain will continue by late morning as temperatures climb into the upper 30s, lower 40s by mid afternoon.

Rainfall amounts will be significant. See graphic below.


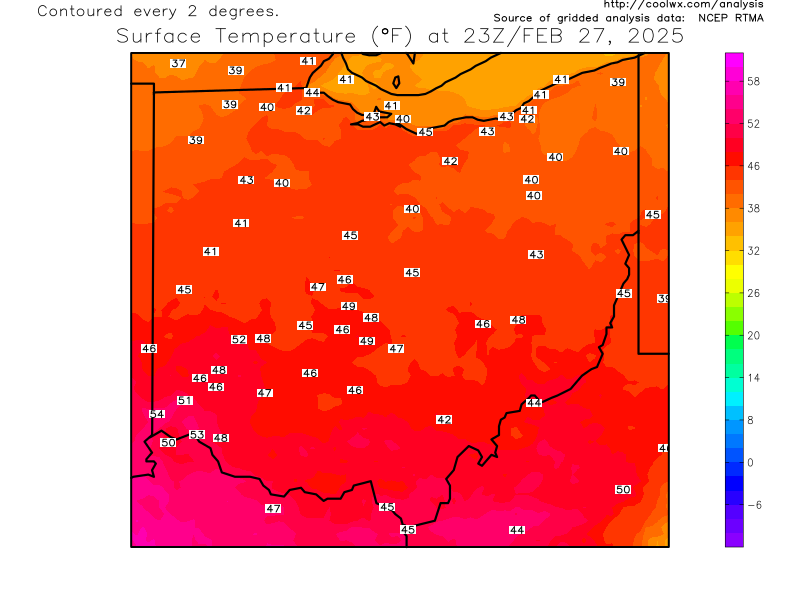
Current OHIO temperatures


Current Ohio Valley radar loop
Central Great Lakes sector loop


Temps will climb into the 50s tonight and early Sunday then drop by late afternoon.


Arctic air returns next week with lake effect on Monday, General "Clipper Snow" Tuesday for all of northern Ohio (several inches very possible) then more lake effect Wednesday and early Thursday. Its not only Cleveland and northern Ohio. Much of the eastern 2/3rds of the US will experience temperatures similar to last January.


Lake Erie water temperature is 37. Typically we need an approximately 23 degree temperature difference (Fahrenheit scale) between the lake water and the air aloft (5000 foot level) for lake effect to develop. That puts the threshold at 14 degrees Fahrenheit at 5000 feet. By Wednesday of next week, the temperature will drop to -9!  Again, this is all in Fahrenheit.  (-22 to -25 for meteorological purposes in northern Ohio). For comparison, the "Polar Vortex" event last January had a 5000 foot temperature (850 mB) of -23.

Daytime highs might stay in the single digits Thursday according to one projection.


I hesitate to give snowfall projections this far out. But considering that the extended models have been very consistent with this arctic air or late (some too warm; some too far west with the cold), posting a preliminary snow forecast seem reasonable. TUESDAY'S CLIPPER could drop between 2-4"+ across northern Ohio.

By the end of next week, significant snow cover will blanket much of the snowbelt.  Get ready.  Winter is back!


Wednesday, November 19, 2014

Buffalo Lake Effect Events: Oct 12-13, 2006 vs Current Event

I remember the October 2006 lake effect snow event well. I was sitting in the WJW FOX 8 weather center watching a band of snow moving parallel to the Lake Erie shoreline about 15-20 miles offshore near Ashtabula, Ohio.  The leading edge of the snow barreled through Buffalo, New York.


This is the only lake effect event comparable--when looking at the temperature parameters--to the current Buffalo event I can remember. It started on October 12, 2006 and finished the next day.


The Lake Erie water temperature was 62 degrees. The air aloft (5000 feet)--the key level for determining lake effect--was -8 celsius (or 17 degrees F).


The temperature difference: 45 degrees from the surface to 5000 feet.


Here were the 2 day totals:


In the current (November 18-19, 2014) event, the lake water temperature in the eastern basin of Lake Erie is between 50 and 54 degrees. The air aloft (5000 feet) was -18 celsius (or zero degrees F)! 


The temperature difference: 54 degrees from the surface to 5000 feet!


This eastern basin warm pocket fueled the snow development as the wind paralleled the shoreline before it made landfall south of Buffalo. The key has been the wind direction. The SW wind (now WSW) carried the arctic air directly over the ENTIRE warm pool of water. The fetch over the warm pocket was more than 100 miles! Normally in northern Ohio, the fetch is between 50 and 60 miles from Canada to Cleveland.

Notice the intensity and uniformity of the lake effect snow band compared to the "edgier, disjointed-looking" radar loop from the October 2006 snow event

November 18, 2014 Event


October 12-13, 2006 event
This type of cold in November (850mB temps at -18) has occurred a dozen times in Buffalo (upper air soundings) since 1950, the most recent was last year.
 
Snow forecast map from the National Weather Service office in Buffalo.


Snow totals as of mid evening Tuesday 11/18. Final snow totals coming later in the week.