Showing posts with label temperatures. Show all posts

Tuesday, May 21, 2019

Spring Rainfall/Temperatures/Cloud Cover

April/May 19th cloud cover for each day in Cleveland and Akron

* Bottom of each graph is the ground. Top of graph is 30,000 feet
* Light blue color indicates clear skies
* Black/Grey color indicates cloud cover

Notice more cloudy days this year compared to last year over the same period. Also, Akron has had less cloud cover overall.


CLEVELAND: April-May 2018
CLEVELAND:  April-May 20, 2019

AKRON:  April-May 2018
AKRON: April-May 20, 2019
Mid April-Mid May: Ohio rainfall and temperatures vs normal since 2015

2019

2018

2017

2016

2015


Wednesday, July 01, 2015

Record Setting June Rainfall

The persistent pattern featuring frequent rain across the Ohio Valley ramped up into high gear the second half of June. Most points from Columbia, Missouri east into the Mid Atlantic states received between 100 and 400% MORE rainfall than normal this last month.


Parts of northern Ohio had between 10 and 15 inches as a stalled front oscillated back and forth triggering clusters of rain and storms. Cleveland's monthly total was 3rd most in 145 years, most since 1972.  Ft Wayne, Indiana set their all-time June rainfall record with 11.98". It broke the record for the wettest month set in July of 1986! 

Last summer's wet region was centered in the heart of the corn belt.


This summer's wet areas have shifted east into the Ohio Valley including Pennsylvania, Maryland and portions of New Jersey.


Compare the past two summer to the very warm summer of 2012. Dry conditions prevailed with the development of a flash drought across parts of the US. I gave a talk at the Ohio State Weather Symposium on the causes and the conditions that feed that summer's dry pattern.

My POWER POINT from the symposium is here. Check it out.

The average temperatures for July and August in 2012 were certainly influenced by the lack of rainfall. Notice the location of the temperature anomalies.

Temperature anomalies in 2014 were noticeably cooler over the wetter ground in the Corn Belt.

I emphasize that the rainfall or lack thereof was not the primary driver of the patterns in either 2012 or 2014.  It was an enhancer. June temperatures were at or slightly below normal.


Record high temperatures across the Midwest were markedly lower in 2014 vs 2012.


Big question, how will the June rainfall in the Ohio Valley influence the temperatures in the upcoming weeks?

More than likely, we should see a dampening of long stretches of heat in the mid-west, corn belt and Ohio Valley.  July could end up with temperatures at or below average from St. Louis to Cleveland.


Tuesday, September 02, 2014

How Did This Summer Compare To Similar "Cooler" Summers?


Good day everyone. Now that the meteorological summer period is behind us, let's recap the weather in Cleveland from June through August.  A twitter follower reminded me that you can make numbers say what you want them to say. I responded to him saying that I always aim to paint a broad statistical picture with any weather recap to eliminate any biases and preconceived notions. Prior to the end of August, most of us had already involuntarily created our own narrative about summer before it had ended! So I try to combat the psychology with objective analysis while being cognizant of how people will perceive the numbers I present.

Enough of that, here is what I found. Remember, the time period is from June 1st through August 31st. Here is a quick look at the temperatures versus average across the US and North America. Much of the US especially the interior had temperatures around 1 to 3 degrees below average.


For Cleveland, the average temperature over the 3 months was the coolest in 10 years!


We forget about the summers in the early 2000s and a few in the 1990s.  
2004 and 2000 were far cooler than 2014.


The real temperature story was the number of days below 80 degrees. This summer ranked 5th highest of any summer since 1935.


Summer rainfall was especially high as it was last summer and in 2011.

14.84" was 5th highest in the last 30 years.


The number of days with more than ONE INCH of rainfall was not impressive...

...yet the frequency of 1/4 inch rain events was the 2nd highest (one shy of the record--21--set in 1902) since record keeping began in Cleveland in 1871!

Prior to the late 1920s, the official measurements were taken in downtown Cleveland. Since then, Hopkins Airport is the official location.


* In summary, the summer was the COOLEST since 2004

* The number of days below 80 degrees was the highest since     
   2004

* Most don't remember that 2004, 2000 and 1992 had more

* Rainfall was almost 5 inches ABOVE AVERAGE, 5th  
   highest in 30 years

* The number of 1/4" rain events was 2nd all-time. Only 1975 
   and 1957 matched this summer

Sunday, August 31, 2014

Labor Day Weekend Weather Radar for Northern Ohio

Happy Labor Day Weekend!

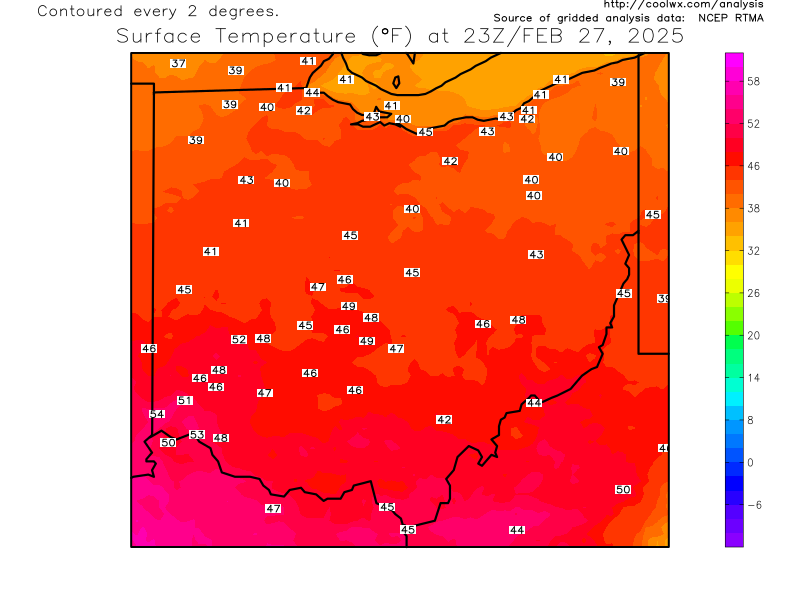
Most of the heavier rain will stay well south today. CHECK OUT THE CURRENT RADAR LOOPS AND CURRENT OHIO TEMPERATURES...


Current OHIO temperatures


Current Ohio Valley radar loop
Central Great Lakes sector loop


Thursday, May 15, 2014

Radar Loops, Heavy Rainfall Forecast

More steady rainfall today. CHECK OUT THE CURRENT RADAR LOOPS AND CURRENT OHIO TEMPERATURES...RAINFALL FORECAST AT THE BOTTOM


Current OHIO temperatures


Current Ohio Valley radar loop
Central Great Lakes sector loop


Projected rainfall amounts are significant. Flash Flood Watch will need to be issued later today by the NWS.


Thursday, April 24, 2014

Is Spring Disappearing?


"It seems like we go straight from winter into summer nowadays."

Its by far one of the most frequent comments I get this time of year. But is it true? Are those traditional spring days from yesteryear being replaced by quicker transitions from winter to warmer days?

A tall order for sure. So rather than relying on our perceptions (I've written extensively how our senses and selective memory fools us by placing more weight on more recent events that match up with our inherent biases) in determining whether or not this "winter-to-summer" trend actually exists, I looked up the average temperatures each day during the meteorological spring months (March through May) over the last 50 years. I plotted the average daily temperature and ran a linear regression of all 92 days (March through May) for each year since 1964 (last 50 years) to determine the rate of warming for each spring.

For example, 2013 looks something like this: 

The "slope" if you remember from grade school math represents the trend. So in last year's case, the slope or trend was a 0.46 degree INCREASE per day from March 1st through May 31st.

That's great but that's only one year. How about the other 49 years?  I won't bore you with each temperature scatterplot but some interesting years stand out. The largest increase per day occurred in 1975. The smallest increase per day occurred in 1973.

Here are the TOP 10 and BOTTOM 10 with the year of occurrence:  Only 2 of the TOP TEN occurred in the last 20 years.
 
Back to the original question? ARE SPRING TEMPERATURES DISAPPEARING IN FAVOR OF A FASTER TRANSITION FROM WINTER TO SUMMER?  MORE IMPORTANTLY, IS THERE A LONGER TERM TREND IN THESE YEARLY SPRING TEMPERATURE TRENDS?
 
I plotted each year's trend with the trend line. The long term trend over the last 50 years is negligible.


However, the same temperature trend data in bar graph form shows HIGHER INCREASES in consecutive years since 2000 (except was 2012).  The increase over the last 15 years is steady around 0.35 degrees per day in spring. We also saw some long stretches in the 1980s equal to recent years.

The 1970s though saw WIDER VARIATION YEAR-TO-YEAR with SMALLER INCREASES compared to recent years of about a tenth a degree lower than the last 15 years. 


So when someone says "Its seems as if spring is shorter" or "We're jumping from winter into summer faster now than in past years", it seems they would be right...but for a different reason.  These changes of a few tenths of a degree over many years are imperceptible to us. My guess is that we take the short term weather changes (a sudden drop from 75 to 35 for example) and believe these changes reflect bigger changes over longer periods. Its a classic example of the RECENCY EFFECT.