Thursday, September 18, 2014

Why Are We Skeptical About Weather Forecasts? How To Fix It


(2nd Edition)

Weather is just as much psychology as it is science. Call it "Behavioral Meteorology".

Most people find it very difficult to grasp the fact that the weather is one big approximation. Not surprisingly, we humans hate approximations and probability. Why? For our minds to grasp probabilities and randomness, we need to be able to handle multiple possible outcomes at once.  The problem is that we are all wired to simplify uncertainty. We want life to be basic and easy to understand. Weather is no different. We all want a forecast that fits a nice and neat one-size-fits-all package.  Unfortunately, weather has many, many outcomes over a large area over a significant period of time. Change the initial weather conditions (humidity, wind flow, frontal position, upper level energy, etc.) and you create more uncertainty. Factor in length of time and the probability becomes significantly higher. We envision an area of rain approaching as a uniform “blob” which moves over our house at say 5:20pm and leaves at 7:15pm. Unfortunately, the actual rain area (or lake effect snow stream) rarely evolves into a tidy, uniform entity.  Instead, it has jagged edges, dry pockets and other random protrusions that impact local forecasts in a few minutes time.  See the problem?

I'd like to say that I make a forecast, short or long term, with a cold, rational, scientific eye but I don't.  I take into account how the general public will react to EVERY word knowing that most people selectively perceive the weather to fit their "sphere of reality". The more we selectively perceive the weather to fit our negative connotation (cognitive bias), the more hyper critical our reaction and the more rigid our bias becomes. It’s a vicious circle that feeds on itself. Throw in the thousands of weather apps out there that claim to provide the forecast for YOUR location along with the Old Farmers' Almanac and the laundry list of cognitive biases (some mentioned above) and you have the confluence of many psychological elements that are difficult to overcome with rational discussion. 

How do we navigate these rough waters of perception and weather bias? 

It all goes back to basic human nature: We all simplify complex, probabilistic themes. We all love a good story with pictures. It’s hardwired in our DNA. Bullet points and/or data without strong associative elements only trigger the Broca's Area and Wernicke's Area of the brain. This area is involved in language processing ONLY.  Brain scans show that if you incorporate emotional elements into your story telling, it will active multiple sensory parts of the brain like the Motor Cortex (body movements) and the Insular Cortex (emotional region) all at once producing chemicals that make us feel good in response specifically Cortisol, Dopamine and Oxytocin. Each one responsible for our involuntary reactions to a good story. We instinctively turn the story into our own personal experience! Given that personal stories make up more than 65% of our conversations, this makes perfect sense.  Here's a great quote that summarizes this up very well:

"THE POWER OF ANECDOTE IS SO GREAT THAT IT HAS A MOMENTUM IN AND OF ITSELF."..."NO MATTER HOW BORING THE FACTS ARE," WITH A WELL-TOLD STORY, "YOU FEEL INHERENTLY AS IF YOU ARE ON A TRAIN THAT HAS A DESTINATION."

A weather forecast is no different. Your brain wants a good story not boring data. This is why we use colorful, pictorial driven graphics like this one. 


Often times if the weather presentation becomes too data intensive, our brain doesn't produce the chemical that make us feel good. Our biases can surface quickly which can alter our perceptions fast. All of this happens in seconds and you've lost the viewer even if the on-air meteorologist has the best of intentions. !

Spaghetti Plot showing forecast uncertainty
Bottom line is a narrative or story is desired versus something that is solely data/science driven. 

Each day, I analyze the science and remember the psychology. I try to tell a compelling, relatable weather story with a dash or two of data, some description of probability and a bit of historical perspective. Human nature is a powerful beast. Each person is different. Sometimes it works for the viewer. Sometimes it doesn’t. 

How do you react when you hear a weather forecast? Do you dismiss the science? Do you like the story? How do you handle probability? Do you like hearing an explanation to why the weather does what it does? Do you overly simplify the weather?

Let me know what you think. 

Tuesday, September 16, 2014

Remnants of Hurricane Ike Revisited

I'm a few days late in publishing this but it's worth a look back anyway. On September 14, 2008, the remains of Hurricane Ike (then a tropical depression at best) moved through the mid west and the Great Lakes ultimately falling a part in southern Canada.


I remember distinctly having to cut up several trees that fell in my backyard only to find that they all had Poison Oak growing throughout. Needless to say, the next two weeks were very uncomfortable.

Two distinct elements were present that allowed Ike to not only hold together but move more than a thousand miles inland. A strong high pressure cell was parked off of the east coast. A strong mid-latitude cold front was sliding across the central of the US. Both acted as a funnel focusing the storm north and east. The upper level pattern was perfectly aligned to drive the surface pattern.
500 mB heights from September 8th to September 15th


Wind gusts across northern Ohio topped out at 71 mph in northern Lorain County.
Rainfall amounts across northern Ohio were very high.


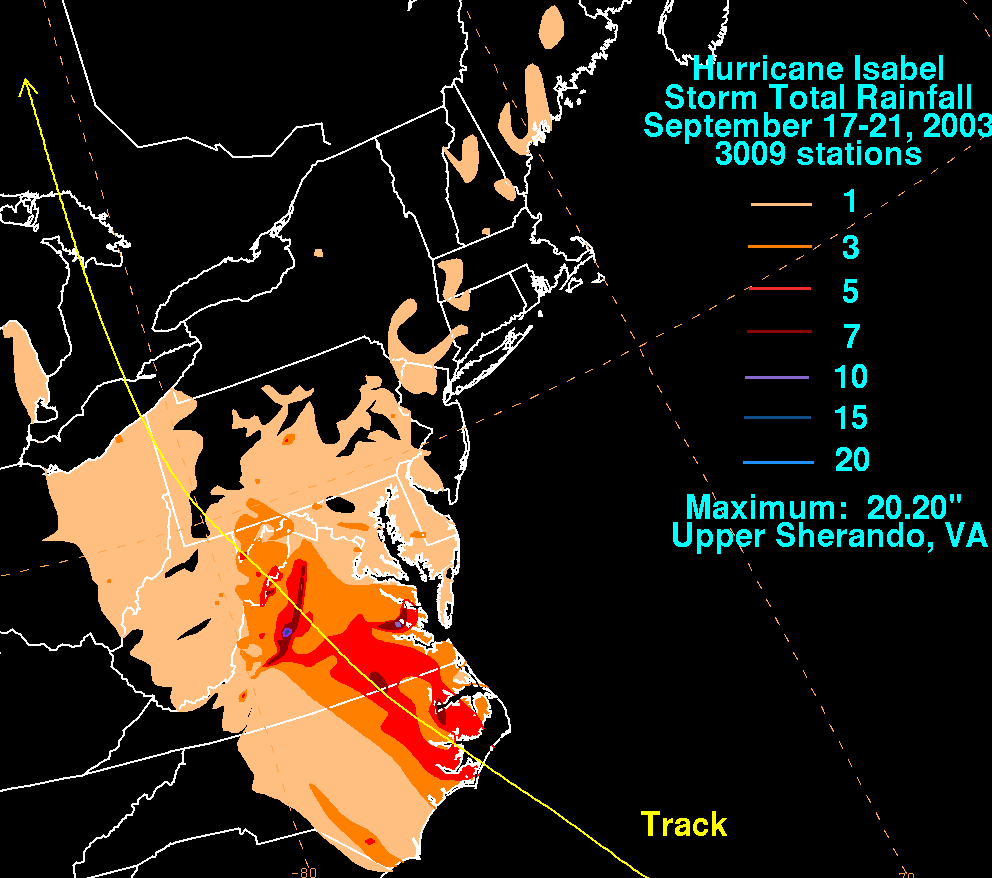
Tropical storms have impacted Ohio before. Remember Hurricane Katrina in 2005? How about Hugo back in 1989?  Here are a few notable storms NOT including Hurricane Sandy as it deserves its own post which you can read HERE.


Wednesday, September 10, 2014

Wednesday 9/10 RADAR UPDATES

CURRENT RADAR LOOPS AND CURRENT OHIO TEMPERATURES. Heavy rain approaching.


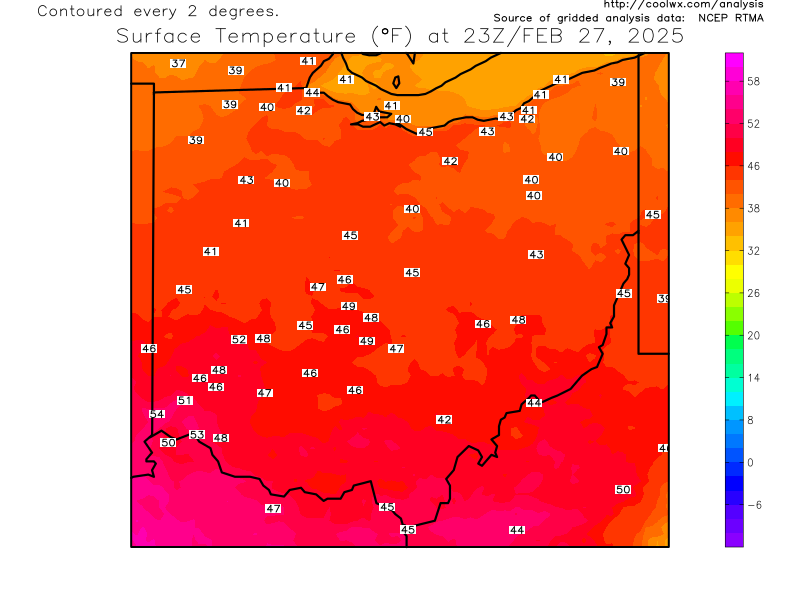
Current OHIO temperatures


Current Ohio Valley radar loop
Central Great Lakes sector loop


Tuesday, September 09, 2014

Huge Temperature Changes...Severe Weather Possible

It's not all that unusual to see large temperature changes driven by strong cold fronts this time of year. Even though it is technically still summer, the sun isn't as strong as it was in early August. The early pushes of cooler air are becoming stronger and larger in extent.  The polar jet stream is starting to become a more dominating force driving mid latitude systems the US and Canada much faster and with more punch. The front forecast to push through the Great Lakes late Wednesday/early Thursday is a prime example.

HUGE temperature contrast along the front.
Incidentally, last year almost to the day, we had a similar cold front and huge temperature contrast. We went from 96 and 95 to 62 in under 48 hours!

Atmosphere is very buoyant.
 Precipitable water values are well over 2 inches!
 
Jet stream winds are very strong. Right-rear quadrant of the jet streak (diverging air aloft) over the mid-west will enhance the severe storms as they pass over Indiana and western Ohio.
Storm Prediction Center continues to show a slight risk for severe storms into northwestern Ohio for late Wednesday and early Thursday.
At this writing, line of storms should pass through northern Ohio between midnight Thursday and Thursday at 6am.
Temperatures will fall into the upper 50s and lower 60s Saturday.

The cool push of air is very strong and will envelop the northern 2/3rds of the US.


Tuesday, September 02, 2014

How Did This Summer Compare To Similar "Cooler" Summers?


Good day everyone. Now that the meteorological summer period is behind us, let's recap the weather in Cleveland from June through August.  A twitter follower reminded me that you can make numbers say what you want them to say. I responded to him saying that I always aim to paint a broad statistical picture with any weather recap to eliminate any biases and preconceived notions. Prior to the end of August, most of us had already involuntarily created our own narrative about summer before it had ended! So I try to combat the psychology with objective analysis while being cognizant of how people will perceive the numbers I present.

Enough of that, here is what I found. Remember, the time period is from June 1st through August 31st. Here is a quick look at the temperatures versus average across the US and North America. Much of the US especially the interior had temperatures around 1 to 3 degrees below average.


For Cleveland, the average temperature over the 3 months was the coolest in 10 years!


We forget about the summers in the early 2000s and a few in the 1990s.  
2004 and 2000 were far cooler than 2014.


The real temperature story was the number of days below 80 degrees. This summer ranked 5th highest of any summer since 1935.


Summer rainfall was especially high as it was last summer and in 2011.

14.84" was 5th highest in the last 30 years.


The number of days with more than ONE INCH of rainfall was not impressive...

...yet the frequency of 1/4 inch rain events was the 2nd highest (one shy of the record--21--set in 1902) since record keeping began in Cleveland in 1871!

Prior to the late 1920s, the official measurements were taken in downtown Cleveland. Since then, Hopkins Airport is the official location.


* In summary, the summer was the COOLEST since 2004

* The number of days below 80 degrees was the highest since     
   2004

* Most don't remember that 2004, 2000 and 1992 had more

* Rainfall was almost 5 inches ABOVE AVERAGE, 5th  
   highest in 30 years

* The number of 1/4" rain events was 2nd all-time. Only 1975 
   and 1957 matched this summer

Sunday, August 31, 2014

Labor Day Weekend Weather Radar for Northern Ohio

Happy Labor Day Weekend!

Most of the heavier rain will stay well south today. CHECK OUT THE CURRENT RADAR LOOPS AND CURRENT OHIO TEMPERATURES...


Current OHIO temperatures


Current Ohio Valley radar loop
Central Great Lakes sector loop


Wednesday, August 20, 2014

Are The Number of Toledo Extreme Rain Events Increasing?

Over the last week, I've read several articles on the increase in extreme rain events as a contributor to the increase in Lake Erie algae bloom frequency.  Here is some rainfall data I compiled for Toledo Metcalf Field. The data goes back to the late 1890s. Instead of using the entire year, I focused on the growing season period from April 1st through September 30th.
A steady increase in one inch rain events since the 1970s. The 1970s and 80s are comparable to earlier decades

The period from 2000 to 2009 wasn't off-the-charts when compared to the 1900s, 1910s or the 1940s. Yet an increase since the 1980s is evident. In the first 4 years (through August 20, 2014) already 17 one inch rainfall events; 3 in 2014 alone.

Several questions come to mind:

1)  Are these rainfall numbers correct?

2)  Is there any record of significant algae blooms in the early 20th century?
If anyone can shed light on any of this, please let me know.


Monday, August 11, 2014

Does This "Cooler" Summer Mean A "Cooler" Fall?

In my last post, several drivers of this summer pattern were described in detail. Some of these carried over from the winter while the building somewhat weak El Nino (though not officially) has been a more recent factor. Some of these will no doubt carry over into the fall.

Rainfall since June 13th (last 60 days as of this update) is running 8-12" above average across a few counties. More than 90% of northern Ohio is running 1-2" above average rainfall.


Let recap: Where does this summer rank through August 2nd?  24th "coolest" in the last 60 years.  We're only talking a few tenth of a degree from year-to-year in some instances.


In those summer that were "cooler" than 2014, the September 1st through October 31st period in Cleveland, HALF WERE SLIGHTLY ABOVE NORMAL AND HALF WERE BELOW NORMAL.


After taking into account the summer drivers (slightly warm water across the tropical Pacific--not quite El Nino--and warm northeast Pacific Ocean), along with the weighted years from Dr. Joe B and Joe D, here is the analog for September and October combined.


This shows that northern Ohio in fall, in those years that closely match with 2014, is normal to slightly above normal.

Tuesday, July 29, 2014

What Is Driving This Cool Pattern? 2014 vs 2009

This unseasonably cool pattern across the Great Lakes and upper mid-west hasn't been completely unexpected. Back in April and early May, we talked about how this summer would feature periods where temperatures would drop below normal. Take a look at the 12 day stretch from July 15th to July 26th. The area of the US that experienced below normal temperatures this year is exactly the same as 2009.

2009 was one of our years we used as a guide in formulating our summer outlook. Remember, this does not include this week's cool-down. I'll redraw this anomaly map at the end of this week.

The upper level (18,000 foot) trough is a bit stronger this year but in the same location as 2009.
Notice where the ridge (high pressure) is located: The western US where the present drought is the most extreme. Drought drives temperatures higher due to the dry ground. The dry ground and heat creates a high pressure ridge. This ridge keeps the dry conditions going further which drives the temperatures higher....and on and on. 
Water temperatures in the Gulf of Alaska are off-the-charts above average this summer (as it was last winter). 

The above normal Gulf of Alaska water temperatures have enhanced the western high pressure ridge by pushing the jet stream further north. The movement of the jet stream is indicated with the red arrow. The strongest portion of the jet stream (highest winds) is shown with the warmer colors over Alaska. The jet on the east side of the ridge dives southeast in the center of the country and bottoms out over the Ohio Valley where the trough is located.

The PNA index is used to measure these pressure patterns across the Northern Hemisphere. When the PNA is positive, the ridge is very strong out west and the trough/low pressure is strong east as it has been since last winter. You can read about it more HERE

The southeasterly jet becomes the conveyor belt for frequent rain and thunder events leading to above normal rainfall across much of the Great Lakes, Midwest and Ohio Valley. This also leads to more frequent periods of below normal temperatures.


For perspective, July in Cleveland, Ohio finished the 6th coolest since 1900.

The average high temperature in Cleveland from July 15th to July 31st was the the second coolest on record!

So the warmer Gulf of Alaska water and the drought out west have significantly boosted the high pressure ridge out west which is reinforcing the trough/cool pattern further east across the midwest and Ohio Valley.  This is not a complete list of the drivers of this summer pattern. The weak El Nino, which garnered a lot of attention during the spring, has had an influence too but not to a major degree. The weak El Nino will factor into our winter outlook which I'll talk about in the fall. Let me know of any other major contributors that I've missed.

Bottom line, it doesn't look like this pattern is going to change anytime soon!