Monday, November 03, 2014

Typhoon Rule: 1976 vs 2014 Mid- November Cold

I've been doing some checking on the Typhoon Rule and compared it to events of the past.  So I checked to see if there was a recurving Typhoon in early November in 1976 since this was one of our analog years for this winter.  Sure enough, there was one:  Typhoon Louise.

So I plotted the surface temps and 500mB anomalies for Nov 1976 period.


The temperatures over the 12 days from Nov 12th to 22nd show the strongest cold air from the 21st to the 24th including three straight days below freezing with some accumulating snow!


The following map is the current setup for the current Typhoon and the temps for mid week next week only 6 days after the Typhoon starts to recurve.  They look similar to 1976! 

I want to reiterate that it's not the Typhoon that causes the cold air/eastern trough.  It's the overall pattern that I'm watching. The typhoon is just one element of it. Let's see if the cold air pans out next week.  Will we see our first lake effect snow of the season?


Wednesday, October 29, 2014

Was Last Winter Really The Worst In Years?


 ...It depends how you define "worst winter in years."

Most of us define past winters using four metrics:  Average Winter Temperature (Dec through February), Seasonal snowfall, Number of nights at or below zero and the number of days with snow on the ground greater than one inch (how often does the snow cover the grass).

I revisit this topic because we will air our Winter Weather Outlook Thursday, October 30th at 10PM. Invariably, everyone is comparing this upcoming winter to last year's rough winter.  If we only had longer weather memories, we'd soon realize that last winter was comparable with winters in the early 2000s both in snowfall and in temperature. 

* Was last winter a rough one?  Certainly. 

* Were the temperatures extreme?  Only the night time lows (6 nights below zero in January, 4 in February--3 were records). 

* Did we break snowfall records?  Nope. Not even close. More snow fell in the winters of 2002, 2003 and 2004.


The graphics below tell the story perfectly.


AVERAGE WINTER TEMPERATURE (DECEMBER THROUGH FEBRUARY)


SEASONAL SNOWFALL - TOP 10 WINTERS


NUMBER OF NIGHTS AT OR BELOW ZERO


DAYS WITH SNOW ON THE GROUND AT OR GREATER THAN ONE INCH


Friday, October 24, 2014

How Are Winter Outlooks Different Than Day-to-Day Forecasts?


Our WJW FOX8 Winter Outlook will air on Thursday, October 30th. Not long after, comments and criticism will start pouring stating in part that we should concentrate on getting the daily forecasts right rather than trying to forecast the weather months out. This isn't new. It happens after each seasonal outlook. Unfortunately, this common comparison is far from accurate and much more complicated than most of us realize.

Actual day to day weather forecasts are developed with analyzing current conditions, radar, satellite and other parameters to make a forecast for a short period of time in the future. 12 Hours, 24 hours, 36 hours, 48 hours. We utilize computer model projections as guidance. These projections are getting better as more data is utilized and assimilated into faster and faster computers. Computer projections are great but they still have their limitations. This is why its important for the meteorologist to determine which projection or combination of projections are accurate. Forecast accuracy continues to climb over the years. The lead time before tornado events has increased significantly saving many lives over the last decade.


Seasonal long range outlooks (winter weather forecasts) are created by looking at the ocean sea surface temperature patterns to include the north Pacific Ocean, the tropical Pacific Ocean (ENSO - two types of El Nino, neutral or La Nina), pressure patterns over the Arctic and North Atlantic, solar cycles, stratospheric wind behavior (QBO) and other longer term variables.  The elements just mentioned are matched up with other years of occurrence.  A best possible seasonal fit is created by "weighing" certain variables higher than others. Sometimes this works out well.  Sometimes it doesn’t.  I've learned a great deal about these variables and how they effect the overall pattern. I'll be the first to admit that I'm not the best. Other meteorologists with far more experience are excellent at determining, weighing and piecing together the years that best fit. Their livelihood depends on it.

To reiterate, the Analog Method is a trend outlook and not for a specific forecast for a specific day. Individual storms cannot be seen this far out. Forecasts for specific days? Forget it. There is too much randomness in the atmosphere that's way beyond our abilities to model accurately. However, by looking at parameters that existed in the past during other storm events, we can say that the chance of a big east coast snow storm is greater or less than in years past. 

For most people, all of these forecasts and trend outlooks are lumped into one group even though each are derived using entirely different information. I get it. Its human nature to generalize and simplify complicated subjects like the science of weather prediction. We formulate concrete, black and white, overly scaled down versions of the weather.  Whether its a long range winter outlook, a climate average for a wedding day, the thunderstorm chances for later this afternoon, lake effect snowfall amounts or a hurricane forecast track, its all the same weather animal to most. We subconsciously eliminate the nebulous science, weird looking equations and fancy internet computer animations in favor of a narrative that tells a better story.  In short, The Old Farmers’ Almanac fits with how our brains are wired.  Its simple. Its folksy with just enough science to make it credible.  Why do we continue believing the Old Farmers’ Almanac?  The simple answer is it makes us feel good!

While I love the Old Farmers Almanac for its articles, I'd trust an actual Meteorologist's forecast first.  I wouldn't dismiss the scientific explanation, ignore the random changes and replace them with the Old Farmers Almanac figuring that its more accurate.  The results are usually disappointing.

So remember that Winter Weather Outlooks are by their very nature formulated differently than day-to-day forecasts.  Let's sit back and see if this winter will behave like we think it will.

Wednesday, October 08, 2014

A Cold/Snowy Winter Coming? Here's A Sneak Peak


Before I go any further, let me make the same declaration I've made in the past shortly before and after we debut any seasonal outlook:  Do not project a seasonal outlook over a specific day in that season! The variables that are used in creating a seasonal outlook are entirely different than what is used to develop a daily forecast. Its a classic "apples to oranges" comparison. Please, head over to my past blog post and read this before you proceed. It will make me feel better :)

Difference Between Day-to-day forecasts and Seasonal Outlooks
http://sabolscience.blogspot.com/2014/04/summer-outlooks-are-different-than-day.html

This winter outlook sneak peak only takes into account a few variables.  (The rest are a part of our secret recipe written on a spiral notebook buried in the FOX8 front yard)  These "few variables" reside in and over the Pacific Ocean.  Take a look at the sea surface temperatures on October 8th.  I circled the regions we've kept an eye on since mid summer.
I will spare you the reasons why these locations are critical...at least for now.  Note that the warmer water in the Gulf of Alaska, the warmer water off the west coast, the cooler pocket of water east of Japan and the weak central based El Nino (Modoki) are all taken into account. When we match up these areas of concern with other years that are similar, we get this analog for the winter months of December through February.

Again, this is an outlook over a 90 day period not a specific day-to-day forecast.

This points to a colder than normal East Coast, Great Lakes and Deep South. The temperature legend is below.


Last year, the core of the cold was centered in the middle of the US. This winter, the core of the cold looks to shift more east and south.


Thursday, October 02, 2014

Huge Changes - CURRENT RADAR LOOPS and OHIO TEMPERATURES

CURRENT RADAR LOOPS AND CURRENT OHIO TEMPERATURE, TEMPERATURE FORECAST THROUGH SATURDAY MORNING


Current OHIO temperatures


Current Ohio Valley radar loop
Central Great Lakes sector loop

Temperature forecast for this afternoon...70s...dropping into the 50s...40s by early morning.


Wednesday, October 01, 2014

HUGE changes Friday & Saturday

Welcome to October.

The deeper we go into October, the possibility of more drastic the day-to-day weather changes increases. The next few days are a prime example.

Central Great Lakes sector loop

High temperatures Friday could push into the 70s before the cold front move through.

Friday's Temperatures
Widespread rain and storms Friday afternoon with scattered storms Friday evening for high school football.

Wind gusts could reach 40+ mph along the front late Friday state wide.

 ...then the big drop Saturday across the midwest and Great Lakes.

Saturday's Temperatures
Look how the flood gates open up as the jet stream buckles across the lakes keeping temps in the 50s through early next week.

It won't be long now before I will need to reference my LAKE EFFECT SNOW EVENTS book!


Friday, September 26, 2014

Does A Mild End Of September Correlate To "Warmer" Winter?

...The short answer seems to be ...YES!


Ah. But wait. Before you start to jump for joy think that this delightful weather with cloudless days, temperatures in the 70s and cool nights means an easier winter ahead like we had in 2010-11,  2011-12 and 2012-13, let me explain what I mean when I say yes.

The operative word here is "correlation". Its like saying that when I cut my finger nails, the weather is cold. These two events might correlate very well but they are far from causal.

Our 8 day forecast calls for a streak of 70+ degree days through at least the 3rd and possibly the 4th of October. If this forecast verifies, the average temperature (day and night) from the start of the 70 degree streak (September 24th) to the projected end would be 65.6 degrees or 19th all-time.

So I checked the years that ranked higher than this projection. Here is the list. It's interesting to note that the end of September last year was a mirror image of this year!  Also notice that 2007, 2005 and 2002 were warmer than this year during the same period.

By blending the years after from 1900 through last year, we get a near normal to slightly above normal temperature pattern Ohio south.

If we remove the years before 1950, we get an even milder result.


However, when we examine the physical drivers of the overall pattern and plug in the years that match up, we get this analog:  (WINTER OUTLOOK SPOILER).  WHOA....HUGE DIFFERENCE!


While this beautiful weather is something to behold, be careful in tying this late September, early October warm period to future trends. More often than not, it doesn't work.

Thursday, September 18, 2014

Why Are We Skeptical About Weather Forecasts? How To Fix It


(2nd Edition)

Weather is just as much psychology as it is science. Call it "Behavioral Meteorology".

Most people find it very difficult to grasp the fact that the weather is one big approximation. Not surprisingly, we humans hate approximations and probability. Why? For our minds to grasp probabilities and randomness, we need to be able to handle multiple possible outcomes at once.  The problem is that we are all wired to simplify uncertainty. We want life to be basic and easy to understand. Weather is no different. We all want a forecast that fits a nice and neat one-size-fits-all package.  Unfortunately, weather has many, many outcomes over a large area over a significant period of time. Change the initial weather conditions (humidity, wind flow, frontal position, upper level energy, etc.) and you create more uncertainty. Factor in length of time and the probability becomes significantly higher. We envision an area of rain approaching as a uniform “blob” which moves over our house at say 5:20pm and leaves at 7:15pm. Unfortunately, the actual rain area (or lake effect snow stream) rarely evolves into a tidy, uniform entity.  Instead, it has jagged edges, dry pockets and other random protrusions that impact local forecasts in a few minutes time.  See the problem?

I'd like to say that I make a forecast, short or long term, with a cold, rational, scientific eye but I don't.  I take into account how the general public will react to EVERY word knowing that most people selectively perceive the weather to fit their "sphere of reality". The more we selectively perceive the weather to fit our negative connotation (cognitive bias), the more hyper critical our reaction and the more rigid our bias becomes. It’s a vicious circle that feeds on itself. Throw in the thousands of weather apps out there that claim to provide the forecast for YOUR location along with the Old Farmers' Almanac and the laundry list of cognitive biases (some mentioned above) and you have the confluence of many psychological elements that are difficult to overcome with rational discussion. 

How do we navigate these rough waters of perception and weather bias? 

It all goes back to basic human nature: We all simplify complex, probabilistic themes. We all love a good story with pictures. It’s hardwired in our DNA. Bullet points and/or data without strong associative elements only trigger the Broca's Area and Wernicke's Area of the brain. This area is involved in language processing ONLY.  Brain scans show that if you incorporate emotional elements into your story telling, it will active multiple sensory parts of the brain like the Motor Cortex (body movements) and the Insular Cortex (emotional region) all at once producing chemicals that make us feel good in response specifically Cortisol, Dopamine and Oxytocin. Each one responsible for our involuntary reactions to a good story. We instinctively turn the story into our own personal experience! Given that personal stories make up more than 65% of our conversations, this makes perfect sense.  Here's a great quote that summarizes this up very well:

"THE POWER OF ANECDOTE IS SO GREAT THAT IT HAS A MOMENTUM IN AND OF ITSELF."..."NO MATTER HOW BORING THE FACTS ARE," WITH A WELL-TOLD STORY, "YOU FEEL INHERENTLY AS IF YOU ARE ON A TRAIN THAT HAS A DESTINATION."

A weather forecast is no different. Your brain wants a good story not boring data. This is why we use colorful, pictorial driven graphics like this one. 


Often times if the weather presentation becomes too data intensive, our brain doesn't produce the chemical that make us feel good. Our biases can surface quickly which can alter our perceptions fast. All of this happens in seconds and you've lost the viewer even if the on-air meteorologist has the best of intentions. !

Spaghetti Plot showing forecast uncertainty
Bottom line is a narrative or story is desired versus something that is solely data/science driven. 

Each day, I analyze the science and remember the psychology. I try to tell a compelling, relatable weather story with a dash or two of data, some description of probability and a bit of historical perspective. Human nature is a powerful beast. Each person is different. Sometimes it works for the viewer. Sometimes it doesn’t. 

How do you react when you hear a weather forecast? Do you dismiss the science? Do you like the story? How do you handle probability? Do you like hearing an explanation to why the weather does what it does? Do you overly simplify the weather?

Let me know what you think. 

Tuesday, September 16, 2014

Remnants of Hurricane Ike Revisited

I'm a few days late in publishing this but it's worth a look back anyway. On September 14, 2008, the remains of Hurricane Ike (then a tropical depression at best) moved through the mid west and the Great Lakes ultimately falling a part in southern Canada.


I remember distinctly having to cut up several trees that fell in my backyard only to find that they all had Poison Oak growing throughout. Needless to say, the next two weeks were very uncomfortable.

Two distinct elements were present that allowed Ike to not only hold together but move more than a thousand miles inland. A strong high pressure cell was parked off of the east coast. A strong mid-latitude cold front was sliding across the central of the US. Both acted as a funnel focusing the storm north and east. The upper level pattern was perfectly aligned to drive the surface pattern.
500 mB heights from September 8th to September 15th


Wind gusts across northern Ohio topped out at 71 mph in northern Lorain County.
Rainfall amounts across northern Ohio were very high.


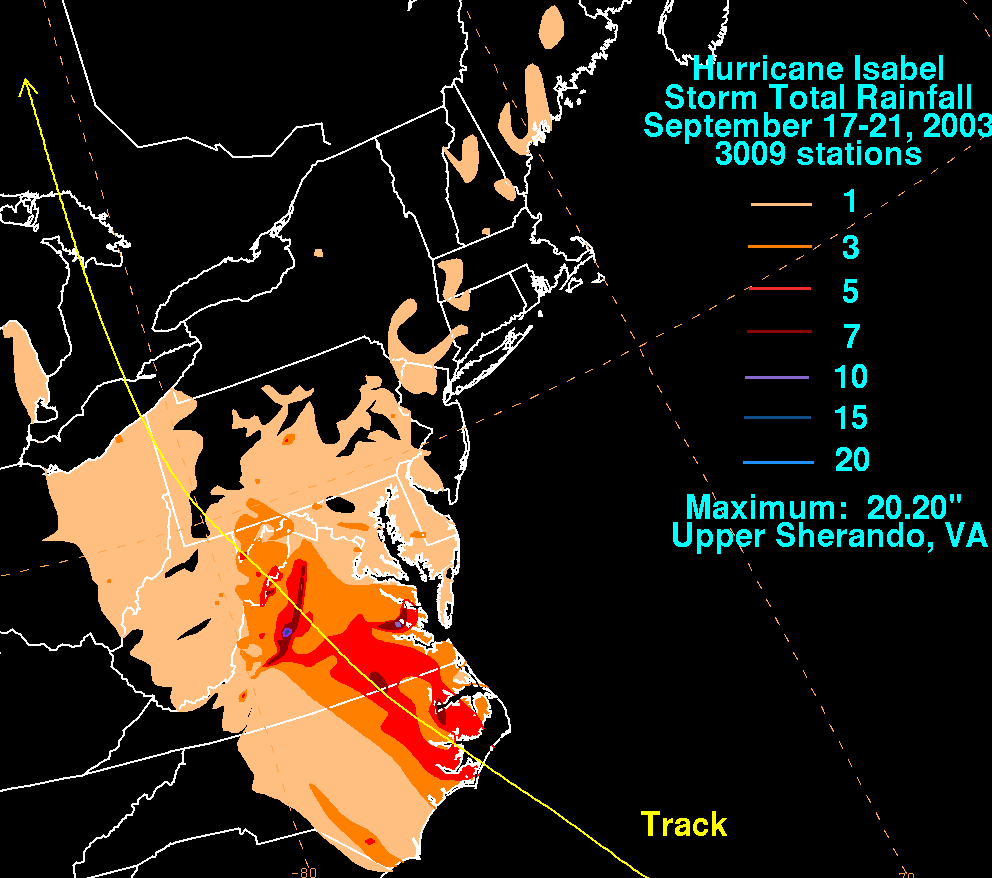
Tropical storms have impacted Ohio before. Remember Hurricane Katrina in 2005? How about Hugo back in 1989?  Here are a few notable storms NOT including Hurricane Sandy as it deserves its own post which you can read HERE.