Saturday, January 03, 2015

Current Radar Loops - Freezing Rain, Steady Rain, Arctic Air

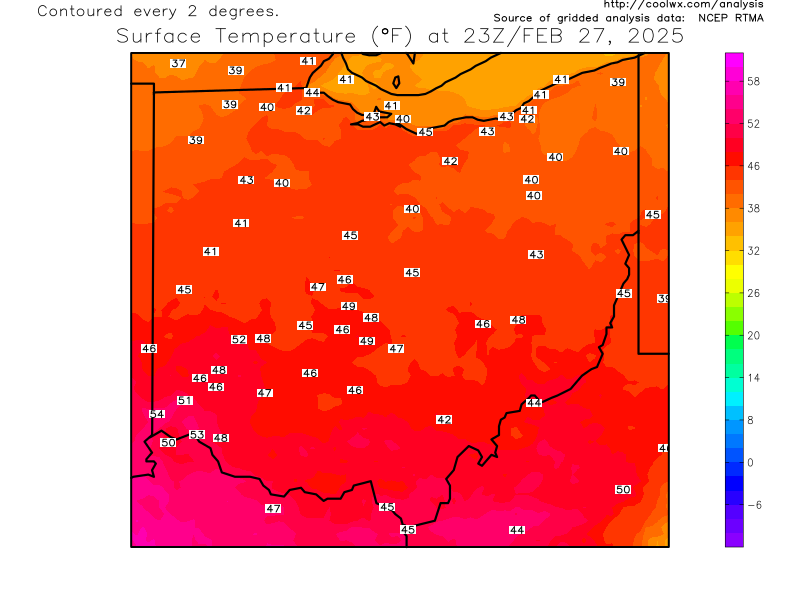
Spotty freezing (rain that hits the ground and freezes on untreated surfaces) will be mixed in with general rain this morning. The transition to all rain will continue by late morning as temperatures climb into the upper 30s, lower 40s by mid afternoon.

Rainfall amounts will be significant. See graphic below.


Current OHIO temperatures


Current Ohio Valley radar loop
Central Great Lakes sector loop


Temps will climb into the 50s tonight and early Sunday then drop by late afternoon.


Arctic air returns next week with lake effect on Monday, General "Clipper Snow" Tuesday for all of northern Ohio (several inches very possible) then more lake effect Wednesday and early Thursday. Its not only Cleveland and northern Ohio. Much of the eastern 2/3rds of the US will experience temperatures similar to last January.


Lake Erie water temperature is 37. Typically we need an approximately 23 degree temperature difference (Fahrenheit scale) between the lake water and the air aloft (5000 foot level) for lake effect to develop. That puts the threshold at 14 degrees Fahrenheit at 5000 feet. By Wednesday of next week, the temperature will drop to -9!  Again, this is all in Fahrenheit.  (-22 to -25 for meteorological purposes in northern Ohio). For comparison, the "Polar Vortex" event last January had a 5000 foot temperature (850 mB) of -23.

Daytime highs might stay in the single digits Thursday according to one projection.


I hesitate to give snowfall projections this far out. But considering that the extended models have been very consistent with this arctic air or late (some too warm; some too far west with the cold), posting a preliminary snow forecast seem reasonable. TUESDAY'S CLIPPER could drop between 2-4"+ across northern Ohio.

By the end of next week, significant snow cover will blanket much of the snowbelt.  Get ready.  Winter is back!


Friday, January 02, 2015

My 2014 Movie List


About 10 years, I began a huge project of creating a list of movies that I hadn't seen.  The rules were simple.  Any movie can make the list--documentary, comedy, drama, it didn't matter.  Little did I know that the list would continue to grow. One movie would lead to a list of movies by the same director or main actor or actress. Pretty soon, I was scouring the AFI top 100 movie list for more additions.  The project snowballed and at the end, the list was almost 500 movies long!


My fanatic movie watching lists since 2009:

2009 MOVIE LIST  100 total
2010 MOVIE LIST  120 total
2011 MOVIE LIST  150 total
2012 MOVIE LIST  110 total
2013 MOVIE LIST    90 total

Here is the 2014 movie list (94) in no particular order:

MY 2014 MOVIES LIST IN NO PARTICULAR ORDER. My favorites in RED. What movies did you see this year? Comment below.

INSIDE LLEWYN DAVIS
AMERICAN HUSTLE
DON JON
LONE SURVIVOR
WEST SIDE STORY
ROPE
DEER HUNTER
CAPTAIN PHILLIPS
ALL IS LOST
AUGUST: OSAGE COUNTY

NEBRASKA
HER
BLUE JASMINE
THE WOLF OF WALL STREET
ENOUGH SAID
MEAN STREETS
PHILOMENA
THE FIFTH ESTATE
FROZEN
CLOUDY WITH A CHANCE OF MEATBALLS 2

JAWS 2
NOBODY'S FOOL
THE CANDIDATE
MUPPET MOVIE
ANCHORMAN 2
OUT OF THE FURNACE
A FEW DOLLARS MORE
THE APARTMENT
DOUBLE INDEMNITY

SECRET LIFE OF WALTER MITTY
THE RESCUERS
LAURA
LIFE AND TIMES OF JUDGE ROY BEAN
CAPTAIN AMERICA
PITCH PERFECT
THE BIG SLEEP
TO CATCH A THIEF
AMERICAN TALE
THE GOONIES

THE BICYCLE THIEF
CAPE FEAR
THE LEGO MOVIE
BEYOND TOMORROW
FRACKNATION
BRIDGE ON THE RIVER KWAI
GRAND BUDAPEST HOTEL
THE GRADUATE
THE NEWTON BOYS
TAPE

BAD WORDS
THE SEARCHERS
THE NORTH FACE
BLUE RUIN
SLACKER
SNOWPIERCER
CHEF
LOCKE

BRICK
THE SWITCH

LAWNMOWER MAN
IT'S IMPOSSIBLE TO LEARN TO PLOW BY READING BOOKS
SUNSET BLVD
EXTRACT
PEABODY AND SHERMAN
DRAFT DAY
EXPENDABLES 3
ONCE UPON A TIME IN THE WEST
CITY LIGHTS
TREASURE OF THE SIERRA MADRE

BOYHOOD
WHIPLASH
GUARDIANS OF THE GALAXY

NONSTOP
TMNT
BIG HERO 6
22 JUMP STREET
TRANSFORMERS 3
INTERSTELLAR
THEORY OF EVERYTHING

HIGH NOON
BEGIN AGAIN
ST. VINCENT
STILL ALICE
COLD IN JULY

UNDER THE SKIN
GONE GIRL
ANNIE HALL
CALVARY
NIGHT AT THE MUSEUM 2

NIGHT AT THE MUSEUM 3
PREDESTINATION
HOW TO TRAIN YOUR DRAGON
IDA


Wednesday, December 17, 2014

The Different Faces of Central Pacific El Ninos

A few weeks back, I had an email conversation with Professor Jin-Yi Yu of University of California Irvine.  I ran across his website and 2009 El Nino paper on Central Pacific El Ninos and was looking for some additional information on what the difference is between a Central Based El Nino and a "Modoki" El Nino according to his work. If you remember, the current Central Pacific El Nino was and still is a significant variable in our winter weather outlook. This is what he had to say after I emailed him the sea surface temperature analog composite for January asking him if this was a Modoki pattern we've heard so much about in the media:


"...this SST anomaly pattern is a Central Pacific El Nino pattern,
not a Modoki El Nino pattern. The Modoki pattern requires the warming in
the central Pacific to be flanked by cooling in the eastern Pacific and
western pacific
".
This graphic illustrates the differences between both El Ninos. El Nino Modoki on top, Eastern El Nino (typical El Nino) on bottom. Notice the cooler water flanking the relative warmth in the middle of the Pacific near the dateline.


Dr. Yu's 2012 paper summarizes each of the 21 El Nino events since the early 1950s using three El Nino Indices. The El Nino Modoki Index (EMI Method), the basic Nino method using the Nino3/4 sea surface temperature readings and the EP-CP Index derived by Dr. Yu and his colleagues published in his 2012 paper. I highlighted the seven consensus Central Pacific El Nino events across all three indices.

7 Consensus Central Pacific El Ninos (The paper above describes what thresholds are used in identifying EP or CP El Ninos.)
While the list above doesn't identify specific Modoki El Ninos among the Central Pacific El Ninos, checking the average sea surface temperatures starting in September and overlapping each month through February/March, "Modoki type" temperature signatures (cold pockets flanking warmth near dateline) can be seen.  Below are the seven consensus Central Pacific El Ninos in chronological order. Each evolved differently. Each one has central warmth (2009-10 was the warmest). Only 1958-59, 1963-64 and 1977-78 seem to have the strongest "Modoki" signature (cool pockets east and west) by visual inspection.

One other note, notice the warmth along the west coast of North America in 1958-59, 1963-64, 77-78 and partially in 2009-10. Professor Yu shows in this paper that this warmth is connected to the development of the Central Pacific El Nino. The coastal warmth is associated with the North Pacific Oscillation teleconnection.

MODOKI signature present
Weaker MODOKI Signature. Not as strong as 1958-59

Weaker MODOKI Signature
Strong Modoki Signature
Weak MODOKI Signature

Weak MODOKI Signature
What can we say about these seven events?  The central warmth seems to mature in January. The cool pools east and west were firmly established by October in the first four events (1950s through the late 1970s).

What about our current event?

The central warmth us weaker than 2009-10. The coastal warmth is off the charts due to the North Pacific Oscillation index rising to the highest levels ever for November going back 60 years! The cold pools east and west are showing some signs of developing.  As of mid December, the Modoki signature comparing all three sea surface temperature regions to the other seven events is weak.

The next 6 weeks will be critical in determining whether this Central Pacific El Nino will continue to mature into a formidable driver of the early 2015 winter pattern. Based on past analogs, it should.


Tuesday, December 09, 2014

Don't Be Fooled. Lots of Winter Left!


Winter arrived very early this year across much of the US. Per NOAA, the average contiguous U.S. temperature was 39.3°F, which is 2.4°F below the 20th century average. This ranked as the 16th coldest November in the 1895-2014 record, and was the coldest November since 2000.

US snowcover for the month was the most since 1966, a 48% increase from last (2013) November's snowcover.
November temperatures in northern Ohio were the 8th coldest on record at 37.1 degrees with a stretch of 9 days below 40. November snowfall was the most since 1996. We are ahead of last year  when we count days with at least ONE INCH of snow cover at 12 (only 9 as of Dec 9th last year).
Many people falsely believed that the arctic cold would continue into December. Look at the top 16 coldest Novembers (16th is this year) in the chart below. Then look at the Decembers that followed. The temperature ranks are no where as cold relative to normal. The Decembers that followed had an average temperature rank of....48th!  Only 2 cracked the top ten coldest.


Here is a comparison of November vs December through the 9th.  December temperatures are not as cold relative to normal. The coldest air has lifted back into central Canada.

So what does this mean looking into our winter future?

All of the factors that went into our winter weather outlook are still present and valid. Nothing has changed.

1) Central Based El Nino has developed or is developing depending on which index you use. This central based Pacific El Nino favors colder than normal temperatures across the eastern US. Note the warm pool along the equator and the smaller cool pools flanking it. The cool pools are indications of a Modoki along with warm pool extending along the west coast of North America.
Are their similar years to what we see above?  Yes.  Below is a blend of those similar years. The scale is a bit different but the warm and cool pools are in similar locations and intensities. They're not exact matches but they are close.


2) Warmer than average water off of the west coast along with the cool pool north of Hawaii strongly favor ridging in the western US, troughiness in the eastern US. The Pacific North American Index (or PNA Index) measures this tendency. In most Decembers where the PNA is more than +1, the temperatures across the eastern US are usually below normal.


 The forecast continues to favor a POSITIVE PNA into mid December.
3) The wild cards are always how the Arctic and North Atlantic will behave.  The Arctic Oscillation and North Atlantic Oscillations are indices that measure changes in the pressure patterns over each location. The AO is more of a player earlier in the winter, the NAO during the second half. If the indices are negative, the pressure patterns favor a more variable jet stream with a tendency for more cold air outbreaks.

4) The QBO (another wild card), read about it here, are stratospheric winds over the tropics which alternate direction easterly to westerly every 2 years. These easterly winds have been shown to disturb the Polar Vortex over the arctic making it more unstable. The propensity for cold outbreaks is higher across North America but not guaranteed. We monitor warming in the stratosphere over the arctic. Sudden warming can be a sign of a weakening of the jet stream and colder outbreaks. A good description of these warming events is on this site. Check out this site for more on Sudden Stratospheric Warming events and their potential effects on our winter weather.

Each one of these variables should not be overstated. One factor doesn't make-it or break-it. Our outlook is a blend of the combined influences that each one of these variables bring to the table. All told, our Winter Weather Outlook from early November still stands


ABOVE NORMAL SNOWFALL AND BELOW NORMAL TEMPERATURES FOR NORTHERN OHIO FROM DECEMBER THROUGH FEBRUARY.



Tuesday, December 02, 2014

Signs of Colder Air Returning Before Christmas

You live by your long range outlook sword and die by it.

This past summer and fall, we hinted that the variables present across the globe were conducive for a colder/snowier winter ahead. November big start out of the gate was a big sign that winter will be cold and snowier than average.

This brings me to the present "break" in the arctic air.

High temps across the eastern US trend slightly above normal by the weekend. Typically when November temperatures average as cold as last month did, bounce-backs are not that uncommon in December.

What has me concerned is the Typhoon in the eastern Pacific. Two models have it recurving back to the northeast next week with it eventually getting absorbed into the Alaskan low which boosts the western ridge making eastern US troughs/colder intrusions that much easier.


The American Model also shows the recurvature by December 10th


 The European is the only outlier with a more westerly track.

Remember the old Typhoon Rule? It states that when Typhoons recurve north and east near Japan, this signifies the overall pattern is conducive for below normal temperatures across the eastern US. See my post a few weeks back on this HERE.

The PNA pattern is showing a strong tendency toward positive which indicated the ridge is rebuilding in the west which drops the trough/colder air east.

I ran a composite of all December years where the PNA index was PLUS ONE OR HIGHER and MINUS ONE OR LOWER. You can see how these correlate strongly to extreme temperatures cold and warm.

PNA at -1 or Below correlates to MILDER EAST

PNA at +1 or Higher correlates to COLDER EAST
Sure enough, the European and Canadian models both develop the beginnings of an eastern trough by December 16-17.


So unless the typhoon tracks further west and doesn't recurve and the PNA pattern (which has trended colder across the US for a while now does a complete 180 degree flip), I would expect temperatures to trend colder the week before Christmas with higher chances of lake effect snow.


Wednesday, November 26, 2014

East Coast Thanksgiving Snow Update

East coast storm continues to churn northeast up the coast. Current radar loop below.

Central Great Lakes sector loop

I'm sticking with National Weather Service snowfall forecasts at this stage of the game. Heavy snow should stay inland away from major cities like New York City and Boston. Philadelphia will see the most accumulation.


Tuesday, November 25, 2014

Major East Coast Snow For Thanksgiving

Significant east coast storm will impact travel tomorrow and Thanksgiving. Expect significant flight delays out of all major hubs tomorrow and early Thursday.

Central Great Lakes sector loop

Probability of at least 6 inches of snow is greatest from Allentown, PA northeast into southern New Hampshire.

The newest projections are bringing the heaviest snowfall further west.


National Weather Service snowfall forecasts.

CLICK THE LINKS BELOW FOR SNOWFALL FORECAST UPDATES

NWS Philadelphia
NWS State College, PA
NWS New York City
NWS Binghamton
NWS Boston


Washington, DC area

Philadelphia
Central PA
Central New York

New York City Metro

Boston, Connecticut, Rhode Island