Thursday, July 25, 2019

What Caused the Lake Erie Water Temperature Changes Recently?

A huge upwelling event occurred along the eastern shoreline of Lake Michigan earlier this week. Water temperatures dropped from the lower 70s to the upper 40s in under 24 hours! Why did this happen? The Grand Rapids, Michigan National Weather Service office has a great graphic that describes what upwelling is.


Can this occur along the Lake Erie shoreline here in Ohio? Absolutely. In fact, some significant temperature changes occurred about 24 hours after the Lake Michigan event just offshore near Cleveland.

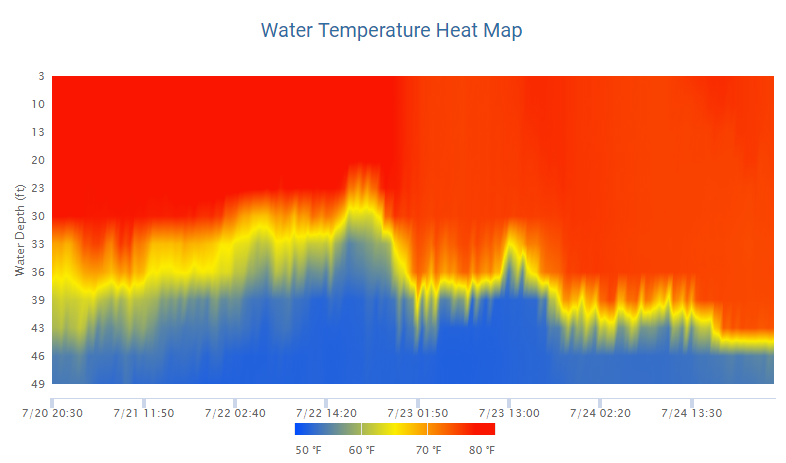
I created a basic animation showing how the water temperatures fluctuated earlier this week especially as depths between 20 and 40 feet. One short-lived drop of around 10 degrees at 23 feet, steadier drops at 30 feet with a spike of more than 20 degrees at 30 feet. At 40 feet, water temps rose from 52 to 75 degrees in under 24 hours. Below that depth, water temperatures have been consistently near 50-55 degrees.


Lake Erie water temperature colorized depth map shows the variation under the surface


A sustained north wind developed Tuesday and Wednesday...


Wave heights had a big spike as the north wind took over.


North wind and higher wave heights match up with the drop in temperature.


Thankfully the bulk of the colder water didn't make it all the way to the surface. Temperatures went from 79 to 73 degrees at this buoy. Temperatures stabilized over the next 24 hours

Bottom line is never under estimate the influence the north wind has on Lake Erie conditions. The higher waves are the changes we see on the surface. The rough conditions under the surface either through strong rip currents or temperatures drops to levels that can cause hypothermia are not as obvious and lesser known.


Tuesday, July 23, 2019

Northern Ohio Heat Index History

After the recent extreme heat and humidity across the country where more than 85% of the 48 contiguous state had temperatures above 90 degrees with heat indices above 100 across 30 states, many have asked how this heat wave has compared to past heat waves here in northern Ohio.


HIGHEST Heat Index levels for every hour in Cleveland since 1948 (Hopkins Airport)


Highest Dew Point for each hour - Cleveland (Hopkins Airport)


For comparison, the LOWEST wind chill (feels like temperature) for each hour since 1948


What are the longest stretches with a heat index of 100+?


How about the years with the most hours with heat indices of 100+ since the late 1980s?

This summer refers to 2019

All of the 100+ heat index stretches greater than 4 hours each year since 1950


What is the all-time heat index record?

178 degrees!

Air temp: 108, dew point: 95 in Dhahran, Saudi Arabia, July 8, 2003