
Thursday, July 11, 2019
Late June-Early July Lake Erie Water Temperatures
Quick look at satellite (GLSEA) Lake Erie water temperatures between June 25 and July 10 over the last 10 years

Tuesday, July 09, 2019
Baseball At The All-Star Break vs Last 10 Seasons
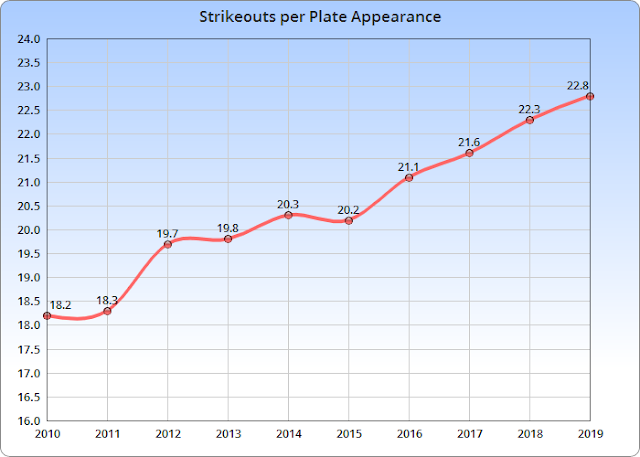
Major League Baseball at the All-Star break. Unless otherwise noted, the graphs below shows numbers through the first half of each season (All-star break) since 2010. All data via Fangraphs and Baseball-Reference
First, home runs per plate appearance:

Percentage of ALL BALLS IN PLAY that are Home Runs continue to climb

Percent of Runs that come via Home Runs:

How often are balls put in play? Numbers have been dropping especially since 2015

Baseball's "Three True Outcomes" (Walk, Strikeout and Home Run) continue to rise

Strikeouts per plate appearance continue to climb:

Strikeouts AND Walks per plate appearance:

As expected, league wide ground ball rates are falling:

Yet flyball rates are steady over the last 3 years:

Flyball Power numbers (Slugging Pct) have increased this season as Flyball rates have stabilized.
 |
| Season Totals |
Power numbers (Slugging Pct) have also increased AFTER 2 STRIKES
 |
| Season Totals |
53% drop since 2011 in Sacrifice Hits
 |
| Season Totals |
Defensive shifts continue to rise (data via Fangraphs)

Subscribe to:
Posts (Atom)