
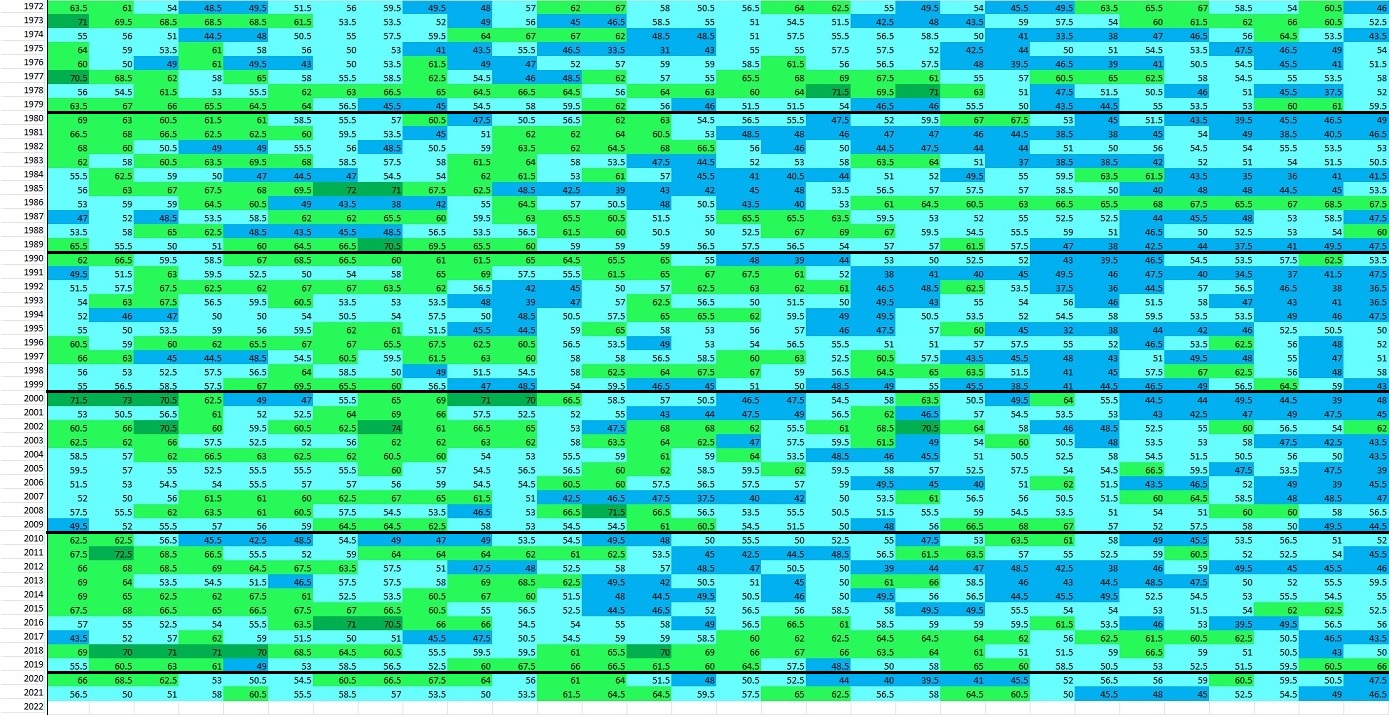
The plots below are the average dew point for each day from June 1 to September 30 since 1972 for Cleveland. I color coded each dew point range for easy reference.
Dark Blue: 30-49°
Light Blue: 50-59°
Light Green: 60-69°
Dark Green: 70-80°
First image is the month of June. Reading left to right for day one through 30. Horizontal black line separates each decade. I notice more breaks from high humidity days in the 1970s and 1980s. More consistently high humidity in the mid/late 1990s into the early 2000s. Recently, lower humidity days seem more frequent in the first half of the month

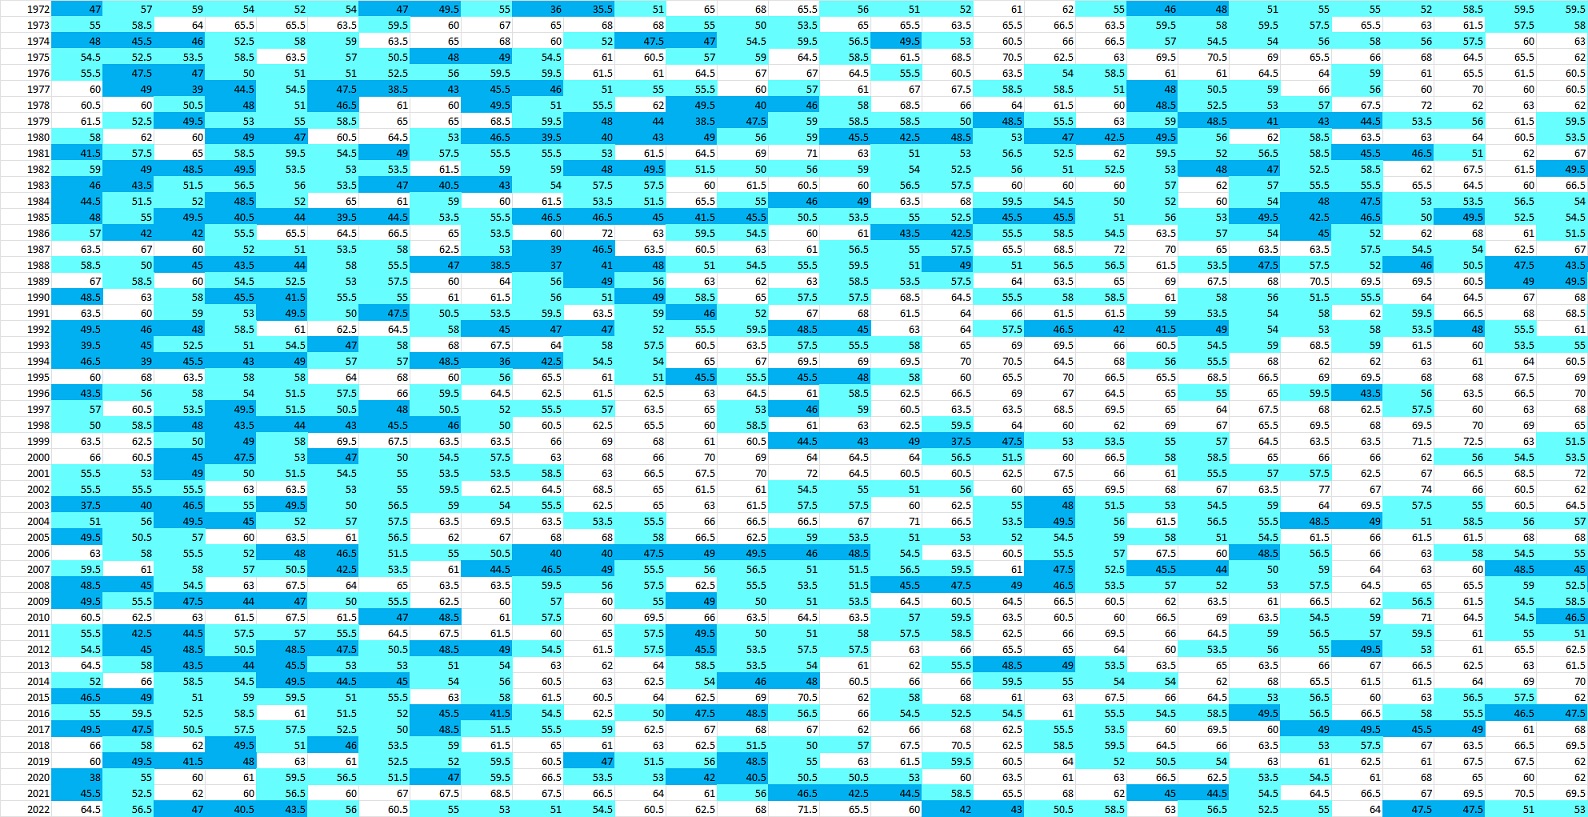
Second image is July. Over the last 10-15 years the frequency of "lower humidity" days (light blue) seems less than previous decades.

Third image is August

Let's only display the days with dewpoints UNDER 60. Basically more comfortable days. Now we can see the frequency of delightful days for each summer month/day. Some quick observations:
* Breaks in the humid days in June look to be more frequent in the 1970s/80s and early 2000s
* Breaks in humid days in July more frequent in the 1970s, early 80s and early 2000s.
* Breaks in humid days in August more frequent in the 1970s.
* Breaks in humid days in early September more frequent in 1970s and 1980s
 |
| JUNE DEWPOINTS SINCE 1972 (UNDER 60) |
 | |||
JULY DEWPOINTS SINCE 1972 (UNDER 60)
|

 |
| SEPTEMBER DEWPOINTS SINCE 1972 (UNDER 60) |
No comments:
Post a Comment