It's a great question.
After all actual snowfall this winter versus the 20 or 30 year averages was extremely low.
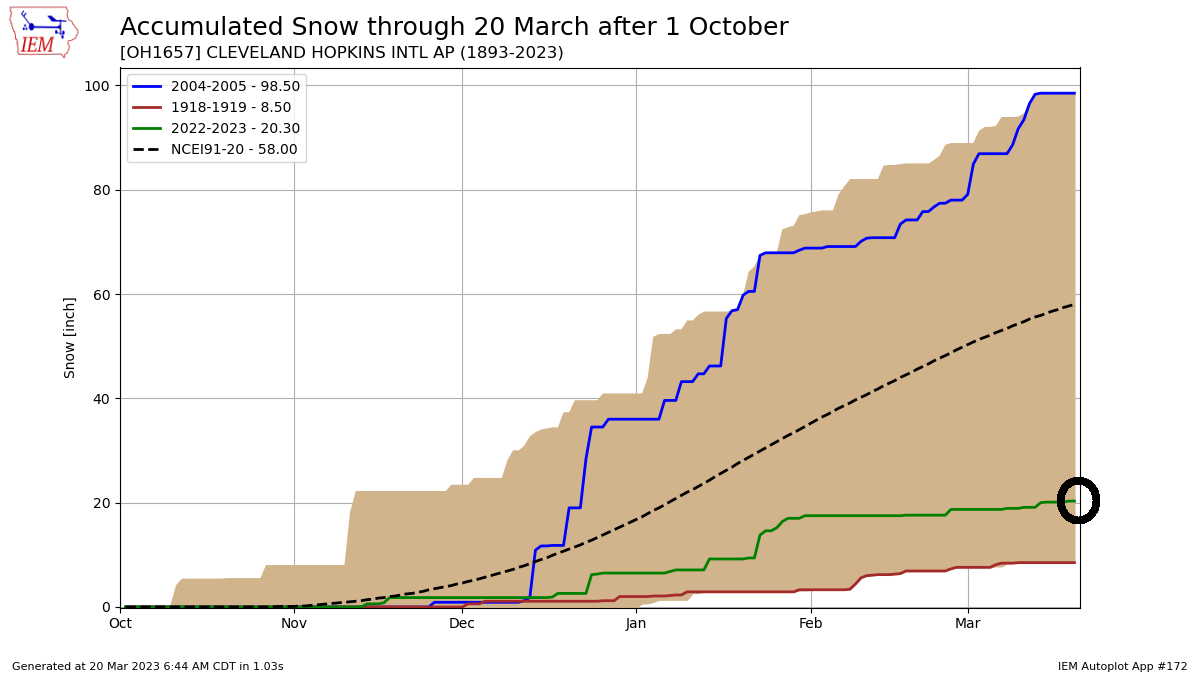
Snowfall as of this writing in Cleveland is barely above 20 inches. Yet the liquid precipitation (rain and snow combined) is north of 12 inches!

Before we attempt to answer this let's recap the winter storm track. After one of the warmest winters on record here in northern Ohio and across a large portion of the Great Lakes and Ohio valley, storm systems coming out of Texas ended up producing more rain on the southern end of the track with heavy snow staying across the northern states. Total precipitation (rain and snow) was well above normal in areas that saw above normal snowfall vs areas that saw more rain than snow.


Total precipitation from November through December was well below normal. January through mid March total precipitation was well above normal.

So how much snow would all of this precipitation give us if we converted ALL of it to snow?
Converting liquid precipitation to snow using a (15" of snow to 1" liquid ratio) would give us these numbers (orange) vs actual snowfall (blue). 15 to 1 ratio is arbitrary as wetter snow would closer to 10 to 1 and super-dry snow could be as high as 25 to 1. I took the middle ground. The higher the orange line, the more total precipitation thus more potential snow (if converted).

Next we need to find the difference between the actual snowfall (blue above) each winter from the total converted liquid to snowfall (orange) to give us the remaining potential snow. The larger the difference, the more liquid precipitation (converted to snow) that winter. I plotted each year's difference in the bar graph below.

The top 10 highlighted below with 2022-23 highlighted for reference.
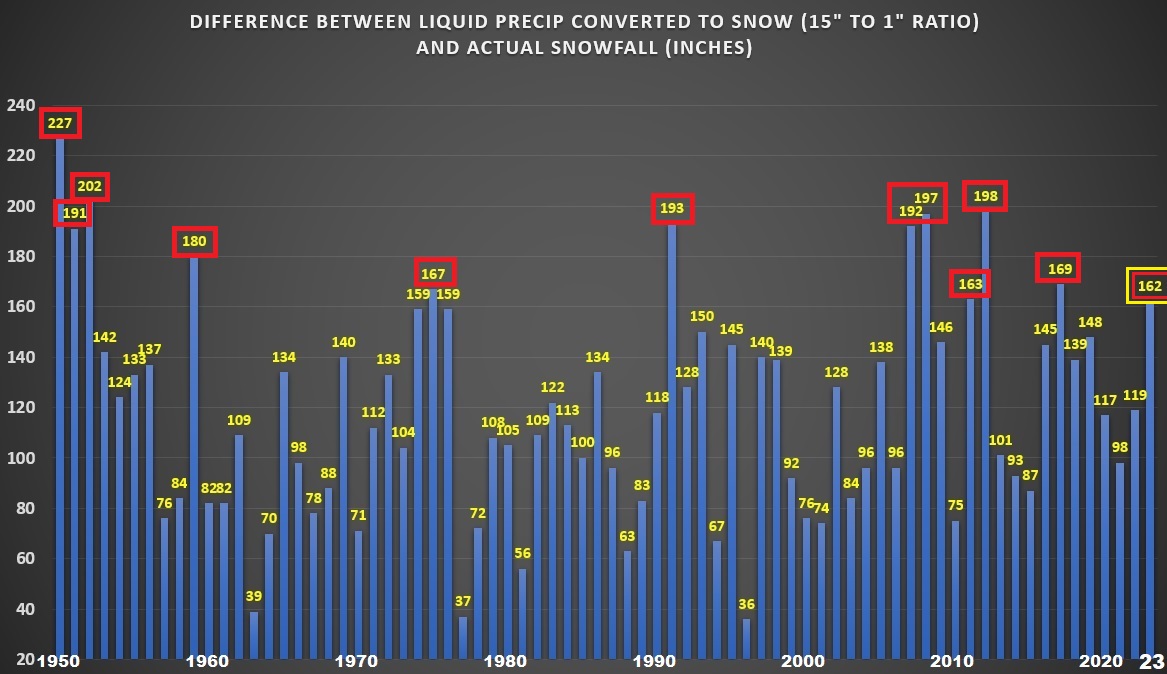
Bottom line is that the winter liquid precipitation (after subtracting the actual snowfall) this winter when converted to potential snow yielded a number just outside the top 10 highest since 1950 (graphic above). This winter had the highest liquid to potential snow since the winter of 2017-18 and a 36% increase comparing this winter to last winter and 65% increase compared to two winters ago. Yet this winter didn't crack the top of the list but its up there.
1949-50: 227"
1951-52: 202"
2011-12: 198"
2007-08: 197"
1990-91: 193"
2006-07: 192"
1950-51: 191"
1958-59: 180"
2016-17: 169"
1974-75: 167"
2010-11: 163"
2022-23: 162"
No comments:
Post a Comment