Tuesday, June 24, 2014

Heavy Rain Update: Flash Flood Potential VERY HIGH

The ground is saturated from Monday's rain. An additional 1-3" of rain a very good possibility over the next 18 hours. Flash Flooding is the greatest concern. FLASH FLOOD WATCH FOR ALL OF NORTHERN OHIO UNTIL 10PM THIS EVENING. THIS MIGHT BE EXTENDED.

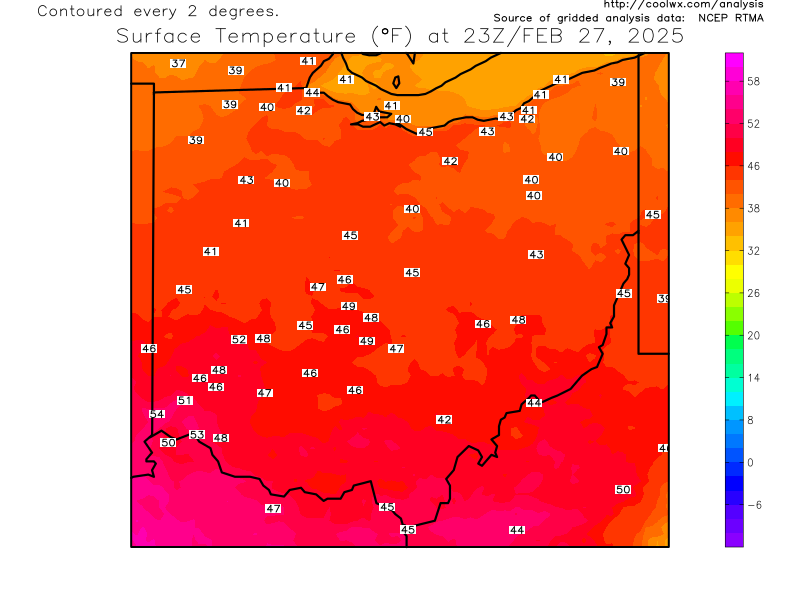
CURRENT RADAR LOOPS AND CURRENT OHIO TEMPERATURES


OHIO TEMPERATURES


OHIO VALLEY RADAR LOOP

Central Great Lakes sector loop

.


Why The Surprise Tornado In Brunswick, Ohio?

Yesterday (Monday 6-24-2014), a tornado touched down just south of RT. 303 in Brunswick without a tornado warning. (Note: A severe thunderstorm warning was issued by the NWS). What caused this tornado to develop? Was this tornado something that could have been foreseen? What happened?

Check out the radar loop I uploaded from yesterday (Monday evening).


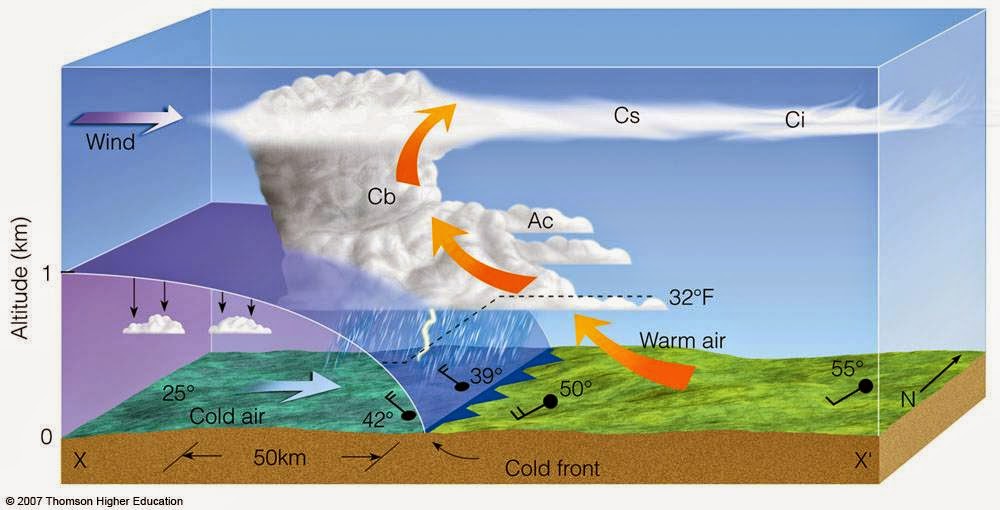
Notice two elements: 1) The line or boundary just south of Lake Erie and 2) The other boundary that moved north of Wooster. These boundaries are called "outflow boundaries" or a "Gust Front". Put simply, these boundaries are like waves that propagate away from a boat that passes In this case, The boundary marks an area of sinking, cooler air that moves away from the first line of storms northeast of Cleveland. Some look like this:


As the boundary moved south away from Lake Erie (and north from near Wooster) it acted as a super-small scale cold front lifting the warm/moist air ahead of it enhancing the storm cluster already moving in from the west causing rotation and ultimately a tornado with winds of at least 110 mph. The convergence of these two boundaries and the established storm from the west (which already had minimal rotation according to the Cleveland NWS) provided the necessary ingredients for a rapidly developing tornado. All of this occurred within 10-15 minutes. Something like this is nearly impossible to forecast.

Tuesday, June 17, 2014

VIDEO: Double Tornadoes in Nebraska

Its a rarity to capture DOUBLE TORNADOES on video.


These tornadoes killed two people in Nebraska (first tornado fatalities in Nebraska since 2004) and leveled a significant portion of the town of Pilger 100 miles northwest of Omaha.

These tornadoes were a part of a fairly large severe storm area Monday.


The Palm Sunday Tornado Outbreak in 1965 featured a double tornado. The Detroit NWS Office has a great discussion on the meteorological setup for that event. The May 3, 1999 event in Oklahoma was a larger outbreak resulting in 74 tornadoes had a double tornado.

Photo: NOAA 1965
The tornado outbreak in 1965 was further east than yesterday's event.

Tornadohistoryproject.com
In most instances when two tornadoes form close to one another, one of the tornadoes becomes the dominant player while one dies away. Yesterday, both tornadoes sustained their intensities creating two separate destructive paths. How strong were these tornadoes? The National Weather Service will survey the damage and make a determination soon.

Friday, June 13, 2014

Awesome Power of Lightning

This video was taken from a security camera from outside the Saratoga Spring Performing Arts Center at the Saratoga Spa State Park in New York back on June 3rd. Notice the tree at the top of the screen below the "4" in "2014".

This is what 50,000+ degrees and a million volts of electricity can do in a fraction of a second.


Wednesday, June 11, 2014

Current Northern Ohio Radar Loop and Temperatures

CURRENT RADAR LOOPS AND CURRENT OHIO TEMPERATURES


OHIO TEMPERATURES


OHIO VALLEY RADAR LOOP

Central Great Lakes sector loop

.


Tuesday, June 03, 2014

Why Do We Dismiss The Science Of Weather So Easily?


Weather is just as much psychology as it is science. I've written about this several times HERE, HERE, and HERE

 I call it "Behavioral Meteorology".


Most people find it very difficult to grasp the fact that the weather is one big approximation.  Weather should be exact right?  Well, we humans hate probability.  Why? For our minds to grasp probabilities and randomness, we need to be able to handle multiple possible outcomes at once. We all want a forecast that fits a nice and neat one-size-fits-all package.  Weather has many, many outcomes over a large area over a significant period of time. Change the initial weather conditions (humidity, wind flow, frontal position, upper level energy, etc) and you create more uncertainty. Factor in time and the probability becomes significantly higher. We want to visualize a line of showers that moves in at a specific time, stays for a select amount of time and then moves out without fanfare. Unfortunately, rain events especially the hit and miss storms that we’ve had across the area recently rarely behave in this manner.

I'd like to say that I make a forecast whether short or long term with a cold, rational, scientific eye but I don't. I take into account how the general public will react to EVERY word knowing that most selectively perceive the weather to fit their "sphere of reality". I learned that quickly years ago. For all of the simulations, super-computers, highly detailed satellite data, it doesn't matter how exact your forecast is or what scientific reasoning you used in coming to your conclusion, people will ignore the facts and the data that disagree with their perceptions and will "rationalize" what they want and react accordingly. More often than not, the reactions are very critical. Worse still, its accumulative. The more we selectively perceive the weather to fit our negative connotation, the more hyper critical our reaction and the more rigid our bias becomes. Its a vicious circle that feeds on itself.  I’ve notice this change over the last 10-15 years. This is called the Disconfirmation Bias. Its the tendency to accept supportive evidence of a belief uncritically, but to discount evidence that challenges that belief.  

Recently, many have already postulated that this string of 80+ degree warmth is proof that this summer will be warmer than we thought.  Its a classic example of the RECENCY EFFECT: This is the tendency to think that more recent trends and patterns we observe (which are more recent in our minds like our recent mild winters) are a very good representation of the entire period in question. We believe our memories and observations--recent warmth and humidity--are excellent predictors of what the near future will bring.  Throw in the thousands of weather apps out there that claim to provide the forecast for YOUR location along with the laundry list of cognitive biases (some mentioned above) and you have the confluence of many psychological elements that are difficult to overcome with rational discussion.

It all goes back to basic human nature. A good weather narrative or story is desired versus something data/science driven. Nebulous weather data and science makes most of us feel uncomfortable even if the on-air meteorologist has the best of intentions.  Sophisticated computer models of the weather have made some very good “probabilistic” outcomes for weather events and situations.. Yet a level of uncertainty still remains and we humans don’t like it! We try to rationalize the irrational. Our biases quickly dismiss the probabilistic science as irrelevant or at the very worst, an excuse.

Each day, I analyze the science and remember the psychology. How you react when you hear a weather forecast? Do you dismiss the science? How do you handle probability? Do you like hearing an explanation to why the weather does what it does? Do you overly simplify the weather?

Deep thoughts this morning...Hmmmmm.
.


Tuesday, May 27, 2014

Spring Weather Scorecard for Cleveland, Ohio


Our meteorological spring (March through May) has continued the unsettled pattern we established in winter somewhat. Temperatures have seemed cooler. Rainfall amounts have seemed above normal. What do the numbers say? Where does this spring rank over the last 30 years?  How about all-time?

Our average high temperatures this spring are running slightly cooler than last year. It has been the 7th coolest spring last 30 years and 67th warmest on the all-time (143 years of record keeping). Remember two years ago? 2012 was the warmest spring EVER.  Yet 2008 and 2005 were COOLER.

How about rainfall? The recent rains and flash flooding give us the perception that this spring was record-setting. This spring ranks 9th wettest over the last 30 years.  We forget 2011. That was the wettest spring EVER. Look at the years circled in green below. The springs in 2011, 2008, 2004, 2003 and 2002 were wetter than this year.

What does this tell us about this upcoming summer?  Not much. Can we use heavy spring rainfall as a predictor of the number of 90 degree days in the upcoming summer?  Not really. In the summers that followed in those wet spring years, here is the 90 degree day breakdown: 

2011:  12
2008:    6
2004:    1
2003:    5
2002:  17


So spring rains are not an accurate predictor of 90 degree days in summer. What we are continuing to watch is the evolving El Nino. I wrote extensively about El Nino and summer outlooks in April and early May HERE, HERE and HERE so check out those links. The outlook for slightly below normal temperatures this summer still stands.

Feedback is always welcome.


Thursday, May 22, 2014

Vivid Lightning Photos

A cluster of storms developed over the western basin of Lake Erie around 6PM Wednesday evening. It continue to slide southeast through Lorain, Cuyahoga, Medina and Summit counties. Viewers captured these cloud to cloud lightning strikes.


Tuesday, May 20, 2014

Never Trust A Warm Front--Heavy Rain Again!

"Never Trust A Warm Front"!

These words of Dick Goddard and Andre Bernier have also been echoed by myself over the years after forecasting many heavy rain and nighttime severe weather events in northern Ohio, West Virginia and St. Louis going back more than 20 years.

Why are warm fronts so tricky? The dynamics of a warm front are completely different than a cold front. The cross section of each tell the story on how the air is stacked above each front. A more detailed technical discussion is located on this site with a nice powerpoint download.

Cold Front Cross Section
Warm Front Cross Section
Clusters of "blob-like" storms tend to develop along warm fronts. These clusters start vie for position and dominance as they move into areas more conducive for sustainability. One cluster robs another of energy/moisture in order to sustain itself while other might shrink.  Yet several clusters might merge together to form one super cluster as was the case on Monday, May 12th. Radar loop is over approx 40 minutes from 8PM to 8:40PM over northern Ohio.


The combination of a moisture-laden atmosphere, rapidly rising and divergent (separating air) at the top of the storms along with hyper-local changes as the storms evolve over a small area make these clusters very difficult to predict more than a few hours in advance in many instances. Their non-linear nature makes it very difficult to determine an accurate track and duration.  They can become especially powerful during the overnight/predawn hours. The high resolution NAM below (future radar) shows several clusters overnight Tuesday into Wednesday more than 24 hours in advance. Their movement is usually west to east or northwest to southeast along the warm frontal boundary.


Compare that to what a "typical" line of storms looks like along a powerful cold front.


So watch the radar below tonight and early Wednesday for the "cluster-type" setup. These clusters can accelerate and morph into hail producing, high wind storms easily reach severe limits.

I GUARANTEE THAT SOME LOCATIONS WILL RECEIVE MORE THAN 1" OF RAINFALL ON WEDNESDAY!


Central Great Lakes sector loop

Saturday, May 17, 2014

Weekend Northern Ohio Radar Loops - Temperatures

CHECK OUT THE CURRENT RADAR LOOPS AND CURRENT OHIO TEMPERATURES


Current OHIO temperatures


Current Ohio Valley radar loop
Central Great Lakes sector loop

.