Showing posts with label baseball. Show all posts

Friday, January 02, 2026

How Baseball Has Changed in 30 Charts - Part I of II


Baseball has gone through changes over the last generation.  The increase in data availability gives us insight on some of these changes. Below is a multitude of charts attempting to illustrate these changes. All data from Baseball-reference and Fangraphs.  All data represents MLB league wide. Part I features general offense and overall pitching.

Wednesday, November 22, 2023

MLB Pitch Clock 2023: How Did It Impact Game Outcomes?


photo courtesy: CNN

Say what you want about the MLB pitch clock and the new rules this past season. The desired effect--to shorten the game--was achieved.

Time of MLB games dropped 


Pace of play (time in between pitches has also dropped)


What about the game itself? 

Larger bases and limited throws to first base with a runner on strongly suggested stolen bases success rates would be higher.  


Shift elimination helped bring the balls in play batting average (BABIP) for left handed hitters in line with right handed hitters.


Weighted on base average (wOBA) also rose.


All of these changes were expected as a result of the rule changes and the addition of the pitch clock. Yet many aspects of the game such as balls in play and the high strikeout totals -- to name a few --remained pretty much the same. 

The 16 charts below illustrate how the core of the game has changed over the last 15 years or so.

Three plate outcomes (walk, strikeout, homerun) rates have been rising since roughly 2010 peaking in 2020 with a small drop in 2021 and 2022 with a jump in 2023 AFTER the rule changes.


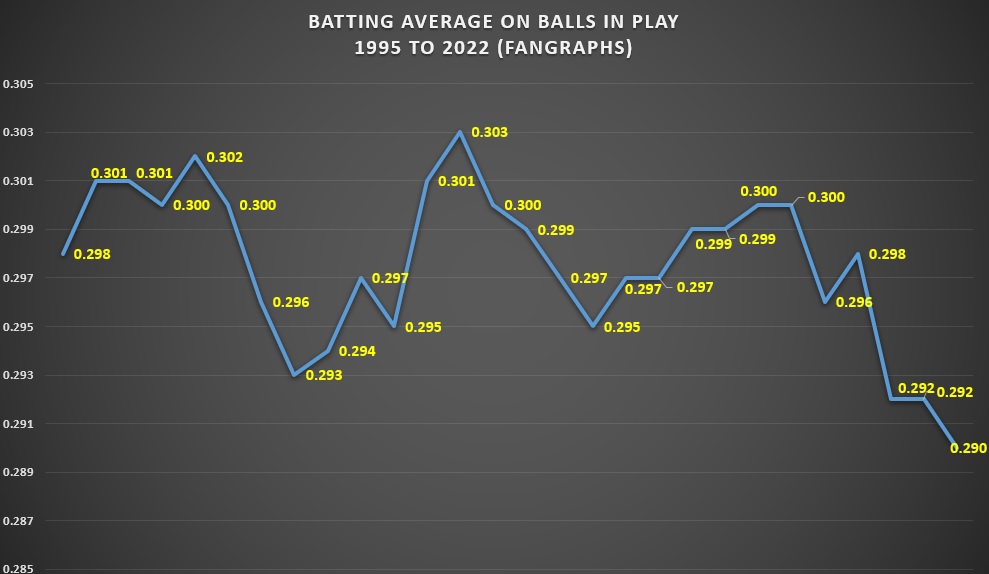
Rate of balls in play started a sharp decline in the late 2000s hitting a low of 67.3% in 2020. A small increase in the last 3 years but no where to the 1990s/early 2000s levels.


Strikeout rates saw a similar rise at roughly the same time. Again little change last season.


Swing strike percentages have hovered around 19% over the last 5 seasons. The increase started around 2010.


The percentage of pitches swung at outside the strike zone started rising in the mid/late 2000s. Rates at 18.1% in 2002, 21.5% in 2005 jumping to near 30% by 2010 where they've stayed ever since.


Contact on pitches outside the strike zone also way up starting in the late 2000s with the rate steady since 2010.


Percentage of pitches inside the zone dropped at roughly the same time.


Flyball rates have rose since early 2010s lows back to early 2000s levels,


Home run rates per plate appearance stayed the same until roughly 2015 then a 35% jump between 2015 and 2019. HR per plate appearances have remained elevated since.


As home run rates rose, slugging percentage on flyballs also rose through 2019. Since then, then have dropped to early 2010s levels.


Percentage of runs via home runs rose in 2023. Overall levels remain at 2016 levels.


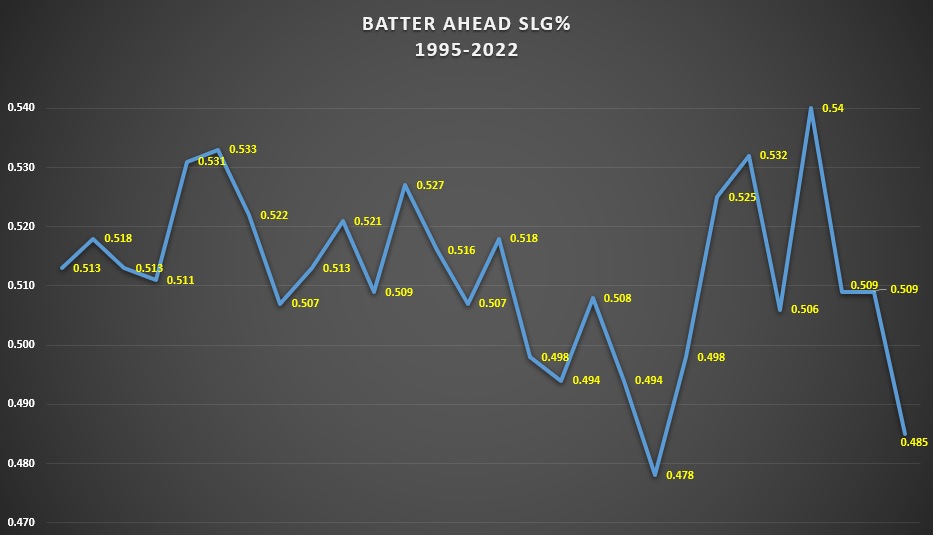
Slugging percentage AFTER 2 strikes started falling in the late 2000s. A few brief jumps but nothing sustainable.  Average "After 2 strike slugging" remains steady over the last decade.


Interesting to note that slugging with runners in scoring position, after a drop between 2006 and 2014, has jumped back to mid 1990s levels.


On top of of offensive changes over the last 10-15 years, pitching speed and frequency has shifted. Velocities are higher across the board.  


Fastball frequency is down more than 12%.  Sliders are up almost 8%. Cutters are up 5% versus a decade ago.  However curveballs and changeups are unchanged.


All of this data points to system wide changes to how game actions are executed. These changes have occurred over almost a full generation.  As of this writing, the 2023 rule changes/pitch clock additions changed base running and defensive alignments. Yet players' approach at the plate and the way pitchers pitch remains so far unchanged. The game is faster, pace of play is down yet the type of baseball we've been watching in recent years remains the same.  Will this change in the next 5 -10 years? 

Friday, April 07, 2023

Cleveland Baseball Opening Day Weather History

I checked the temperature for every "opening day" since 1871 when the professional baseball team was called the Cleveland Forest Citys.  Listed here are the warmest and coldest at each major ballpark.


Cleveland professional baseball started in 1869 with the first professional game played near the present day E. 38th street in between Scoville and Central Avenues in 1871 at a park called the National Association Grounds which is near the current Ensign Avenue and. E 55th. The team was named the Cleveland Forest Citys after the Forest City Coffee Company. They lost 25-6 to the first professional baseball team the Cincinnati Red Stockings.

Location of the Cleveland Forest Citys Park in 1871


Since that year, professional baseball in Cleveland faded in and out of existence as it did in other cities back then. In 1871 and 1872, a Cleveland team also names the Forest Citys was formed but disbanded. Then from 1879 to 1884, the Cleveland Blues played their games at the Kennard Street Park. During that stretch, they won 4 of the 6 opening days. In 1885 and 1886, no professional baseball was played in Cleveland. But in 1887, Cleveland baseball returned again. Named the Spiders, they won 10 of the next 13 opening days through the 1899 season. Cleveland baseball was played at many locations between 1871 and the present. 

Locations of Cleveland baseball parks since 1871

In 1900, no Cleveland baseball existed because of the ineptitude of the 1899 Cleveland team which had a record of 20-132, still the worst record of any baseball franchise in baseball history. The team subsequently folded.

Starting in 1901, the new American Leagued was formed and Cleveland baseball was born again. Since then, Cleveland baseball has been played in 3 stadiums (League Park, Cleveland Stadium and now Progressive Field)

More than 50% of opening days featured temperatures above 60 degrees. Most of these occurred in the early 20th century when the season was shorter and started later (late April/early May).


Picture from Opening Day in 2007.  Game was postponed and moved to Milwaukee due to snow.


Monday, October 10, 2022

MLB 2022 Recap - Were There Any Significant Changes?


Here are numerous charts showing where the 2022 MLB season compares to recent seasons. 

All data is from Fangraphs and Baseball-Reference


Friday, June 17, 2022

What's Different Between 2021 Jose Ramirez and 2022 Jose Ramirez?


Jose Ramirez is on a torrid pace. He leads the league with 62 RBI.  He's second in slugging percentage at 0.649. Looking at more advanced statistics, the story remains the same. His 0.437 wOBA is good for 4th in MLB.  His wRC+ of 193 ranks 5th. 

What stands out among the top hitters in run creation is their strikeout rate. The average rate of the players below (minus Ramirez) is 19.8%.  Jose Ramirez strikeout rate is... 7.4%. 

We've seen Jose Ramirez put up great numbers in the past. What is different about this season vs last season and others?  Let's examine contact.

Jose has always been a good contact hitter. His contact percentage across the entire strike zone has been between 86-90% over his career. The increase this year is 3% versus last season. What's more noticeable is his productivity increase.

His in-zone contact is virtually identical to last year. Not much change.

Look at his out-of-zone contact. A 10% jump compared to 2021!

He's making more contact at pitches out of the strike zone!  Contact is one thing.  How productive is his contact out of the zone? 

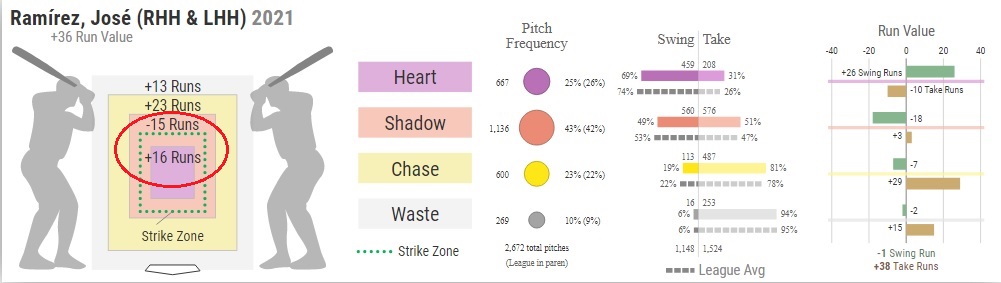
This graphic comes from Baseball Savant. We can assign run values to the strike zone based on each base state during a typical game. Here's a detailed explanation.

Take some time to familiarize yourself with the graphic. There are four regions:  HEART, SHADOW, CHASE, WASTE.  The total number of runs for each region is indicated on the left.  For example in 2021, Jose Ramirez's center of the zone total runs was +16.  Yet his shadow zone was -15 runs.  He was near league average in swings in the shadow zone, his productivity in runs was negative!


Compare last year to this season through June 16.


His shadow zone so far this season: +5 runs vs last year which was -15 runs.  

So far this season Jose Ramirez is 5th in MLB in runs in the shadow area. In 2021 he was 188th!

Basically, he's being more aggressive with more swings at pitches in the outer part of the strike zone and in the area just outside the zone.


Interestingly he is not hitting the ball as hard as last season.  Roughly a 10% drop in hard hit balls. This hasn't impacted his productivity as his overall wOBA is higher than in any previous season through mid June.  One reason for the reduction in hard hit balls is that he is hitting the ball more up the middle and pulling the ball less.

wOBA  Hard Hit%  Center Hit%

wOBA   Hard Hit%   Pull%


Has he made changes in his approach in different counts?

Here are his slugging percentage for each count over the last 5 seasons (not counting 2020).  His slugging is lightyears ahead of last season on the first pitch. 


The changes year-to-year sum it up: He's made significant improvements when ahead in the count especially at 1-0, 2-0, 3-0 and 3-1.  Also, his slugging jumped from 0.493 to 0.613 after the 7 inning!


Sure his production with the bases empty is in line with last year.  However he is productive when it counts. 

wOBA with runners on base/empty

Let's see if these trends continue.