Tuesday, May 27, 2014

Spring Weather Scorecard for Cleveland, Ohio


Our meteorological spring (March through May) has continued the unsettled pattern we established in winter somewhat. Temperatures have seemed cooler. Rainfall amounts have seemed above normal. What do the numbers say? Where does this spring rank over the last 30 years?  How about all-time?

Our average high temperatures this spring are running slightly cooler than last year. It has been the 7th coolest spring last 30 years and 67th warmest on the all-time (143 years of record keeping). Remember two years ago? 2012 was the warmest spring EVER.  Yet 2008 and 2005 were COOLER.

How about rainfall? The recent rains and flash flooding give us the perception that this spring was record-setting. This spring ranks 9th wettest over the last 30 years.  We forget 2011. That was the wettest spring EVER. Look at the years circled in green below. The springs in 2011, 2008, 2004, 2003 and 2002 were wetter than this year.

What does this tell us about this upcoming summer?  Not much. Can we use heavy spring rainfall as a predictor of the number of 90 degree days in the upcoming summer?  Not really. In the summers that followed in those wet spring years, here is the 90 degree day breakdown: 

2011:  12
2008:    6
2004:    1
2003:    5
2002:  17


So spring rains are not an accurate predictor of 90 degree days in summer. What we are continuing to watch is the evolving El Nino. I wrote extensively about El Nino and summer outlooks in April and early May HERE, HERE and HERE so check out those links. The outlook for slightly below normal temperatures this summer still stands.

Feedback is always welcome.


Thursday, May 22, 2014

Vivid Lightning Photos

A cluster of storms developed over the western basin of Lake Erie around 6PM Wednesday evening. It continue to slide southeast through Lorain, Cuyahoga, Medina and Summit counties. Viewers captured these cloud to cloud lightning strikes.


Tuesday, May 20, 2014

Never Trust A Warm Front--Heavy Rain Again!

"Never Trust A Warm Front"!

These words of Dick Goddard and Andre Bernier have also been echoed by myself over the years after forecasting many heavy rain and nighttime severe weather events in northern Ohio, West Virginia and St. Louis going back more than 20 years.

Why are warm fronts so tricky? The dynamics of a warm front are completely different than a cold front. The cross section of each tell the story on how the air is stacked above each front. A more detailed technical discussion is located on this site with a nice powerpoint download.

Cold Front Cross Section
Warm Front Cross Section
Clusters of "blob-like" storms tend to develop along warm fronts. These clusters start vie for position and dominance as they move into areas more conducive for sustainability. One cluster robs another of energy/moisture in order to sustain itself while other might shrink.  Yet several clusters might merge together to form one super cluster as was the case on Monday, May 12th. Radar loop is over approx 40 minutes from 8PM to 8:40PM over northern Ohio.


The combination of a moisture-laden atmosphere, rapidly rising and divergent (separating air) at the top of the storms along with hyper-local changes as the storms evolve over a small area make these clusters very difficult to predict more than a few hours in advance in many instances. Their non-linear nature makes it very difficult to determine an accurate track and duration.  They can become especially powerful during the overnight/predawn hours. The high resolution NAM below (future radar) shows several clusters overnight Tuesday into Wednesday more than 24 hours in advance. Their movement is usually west to east or northwest to southeast along the warm frontal boundary.


Compare that to what a "typical" line of storms looks like along a powerful cold front.


So watch the radar below tonight and early Wednesday for the "cluster-type" setup. These clusters can accelerate and morph into hail producing, high wind storms easily reach severe limits.

I GUARANTEE THAT SOME LOCATIONS WILL RECEIVE MORE THAN 1" OF RAINFALL ON WEDNESDAY!


Central Great Lakes sector loop

Saturday, May 17, 2014

Weekend Northern Ohio Radar Loops - Temperatures

CHECK OUT THE CURRENT RADAR LOOPS AND CURRENT OHIO TEMPERATURES


Current OHIO temperatures


Current Ohio Valley radar loop
Central Great Lakes sector loop

.


Thursday, May 15, 2014

Radar Loops, Heavy Rainfall Forecast

More steady rainfall today. CHECK OUT THE CURRENT RADAR LOOPS AND CURRENT OHIO TEMPERATURES...RAINFALL FORECAST AT THE BOTTOM


Current OHIO temperatures


Current Ohio Valley radar loop
Central Great Lakes sector loop


Projected rainfall amounts are significant. Flash Flood Watch will need to be issued later today by the NWS.


Wednesday, May 14, 2014

Severe Weather, Heavy Rain Outlook

The same system that produced the severe weather Monday has stalled across Ohio focusing more rain and storms over the next 36 hours. Notice the amount of moisture and its Gulf of Mexico origin.

Precipitable Water: WARMER colors mean more available moisture

Projected rainfall amounts are significant. Flash Flood Watch will need to be issued later today by the NWS.


Northern Ohio radar loop


Current OHIO temperatures


Current Ohio Valley radar loop
Central Great Lakes sector loop

Tuesday, May 13, 2014

Northern Ohio Severe Weather Recap. ONE TORNADO CONFIRMED


A pretty big weather day yesterday across northern Ohio. Many severe storms with heavy rainfall (2-5"), 1" hail reported & tornado warnings. 


Many people have complained about our "wall-to-wall" coverage saying that nothing was happening and it wasn't worth it. "No tornadoes on the ground so what is the point of coverage like this?" a few said via Facebook and Twitter.  While its easy to lump this event in with all of the others, this round of severe storm was very different than other severe weather events we've had in the recent past in northern Ohio. Why? First, many of the severe cells had the classic hook echo characteristic indicating strong counter clockwise winds which often indicate a tornado. Thankfully, only ONE TORNADO was confirmed in Lorain County. I thought we'd end up with 4 or 5 easily.


Secondly, many cells also had strong changes in wind direction embedded within them. By using the "Velocity Scan", we can determine which cells have rotational signatures by recognizing those small scale wind direction changes. Green colors mean wind moving toward the radar. Red colors mean wind is moving away. Notice the abrupt change and the implied rotation.


For these reasons, the National Weather Service issued tornado warnings. As a public service, it is mandatory to inform the public of the tornado warnings. Given the numerous storms, we needed to break into programming to cover this event BIG TIME! 

For those of you who claim that more tornado warnings are being issued for northern Ohio, that's not the case. After doing some exhausting research compiling tornado warning history, I found that the issuance of tornado warnings at the National Weather Service office in Cleveland, Ohio (our home office) is trending lower since the early 1990s. Also, the percentage of tornado warnings that result in actual tornadoes here in northern Ohio during the same period is comparable to the national average.


=======================================================================

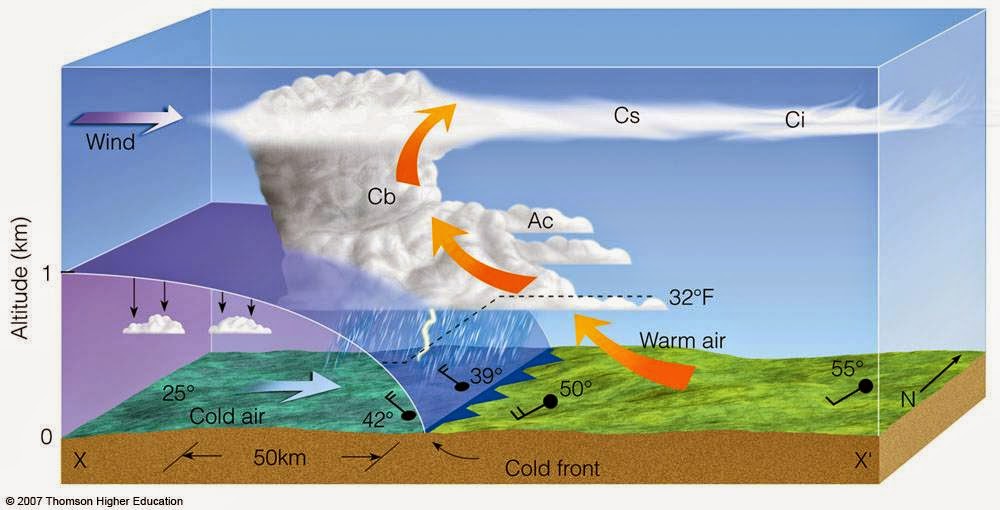
As we recap yesterday's severe weather, its a good idea to review what constitutes a severe thunderstorm as defined by the National Weather Service.


Most storms NEVER reach severe limits. A very small number of severe storms actually produce a tornado. That's comforting news for all of us. That said, the mere mention of the word "severe" has extreme connotations. Many people believe that the word "severe" means "tornado". Nothing could be further from the truth. Here are the tornado facts and figures that I hope set the record straight.

* 5% of storms are severe. Only 1% of storms produce tornadoes

* Tornado warnings are issued for about 75% of all tornadoes

* In 2007, the National Weather Service started to issue warnings on a more local level versus on a county basis. These "polygons" localize the threat inside a specific part of a county.

* Tornadoes occur over a wide spectrum of strengths, sizes, and lifetimes.  Of the 800–1400 tornadoes reported in the United States each year, about 86% can be characterized as weak, 13% as strong, and 1% as violent.  

* In general, weak tornadoes (86%) have lifetimes less than 10 min, widths around 100 m (yards) and paths less than 1.6 km (1 mile) in length.  National Weather Service radars can complete ONE SCAN every 4 to 6 minutes! 

* Typical tornadic wind speeds are on the order 110 mph.   

* The average “lead time” for tornado warnings was less than 5 min in the late 1980s. By the late 1990s, lead time was up to 10 minutes; 13 minutes today (2014)

* National Weather Service forecasters provided a 24-minute lead time for tornado warnings in Joplin, Missouri back in 2011, almost TWICE the national average

* According to one study in 1978, there was a 22% probability of tornado detection with a 3 minute warning lead time. By 1998, the probability had jumped to 65%! 

Thursday, May 08, 2014

How far Behind Is The Growing Season?


The growing season is starting off slower than last year. The soil temperatures have been slow to recover after the very cold winter and early spring.


Agriculture experts use GROWING DEGREE DAYS as a measure of GROWTH RATE in plants and insects. By tracking the average temperature and plugging it into a simple equation HERE, a measure of whether or not the growing season is ahead/behind can be found. Notice that this year's growing season (through May 7th) is very similar to 2011 but way behind last year. Incidentally, the start of the 2010 and 2012 growing season was the earliest in 140+ years of northern Ohio record keeping using the GDD measure. To put this another way, last year's (2013) growing season was at this year's level (151) more than a week ahead of this year.  In the record setting warm spring of 2012, the growing season was at this year's level on MARCH 21st!


Each plant, tree and insect has its own thresh hold depending on the specific location. Just plug in your ZIP CODE. By checking a plant or insect's GROWING DEGREE DAY, you can determine when it will first bloom or hatch.  Here is brief summary of the list for Medina, Ohio. You can see what has bloomed and what will bloom in the near future.


Wednesday, May 07, 2014

Thursday, May 01, 2014

Detailed Summer Outlook: How Many 90 Degree Days/70 Degree Days?

Last week, I wrote about how we derive our summer outlooks by analyzing ocean sea surface temperature patterns (El Nino, etc), pressure patterns over the Arctic and North Atlantic among some others. The elements just mentioned are matched up with other years of occurrence. A best possible fit is created. Remember that specific day-to-day weather is never the objective.  Its impossible to determine the weather for specific days months out contrary to what the Farmers' Almanac says.

So what were CLEVELAND summers like in years that match up similar to 2014?  90 degree days, overall rainfall, days with below normal temperatures? Here is a quick graphic...