Showing posts with label lake erie ice cover. Show all posts

Wednesday, February 05, 2025

Lake Erie Ice Cover History UPDATE (1972-Present)

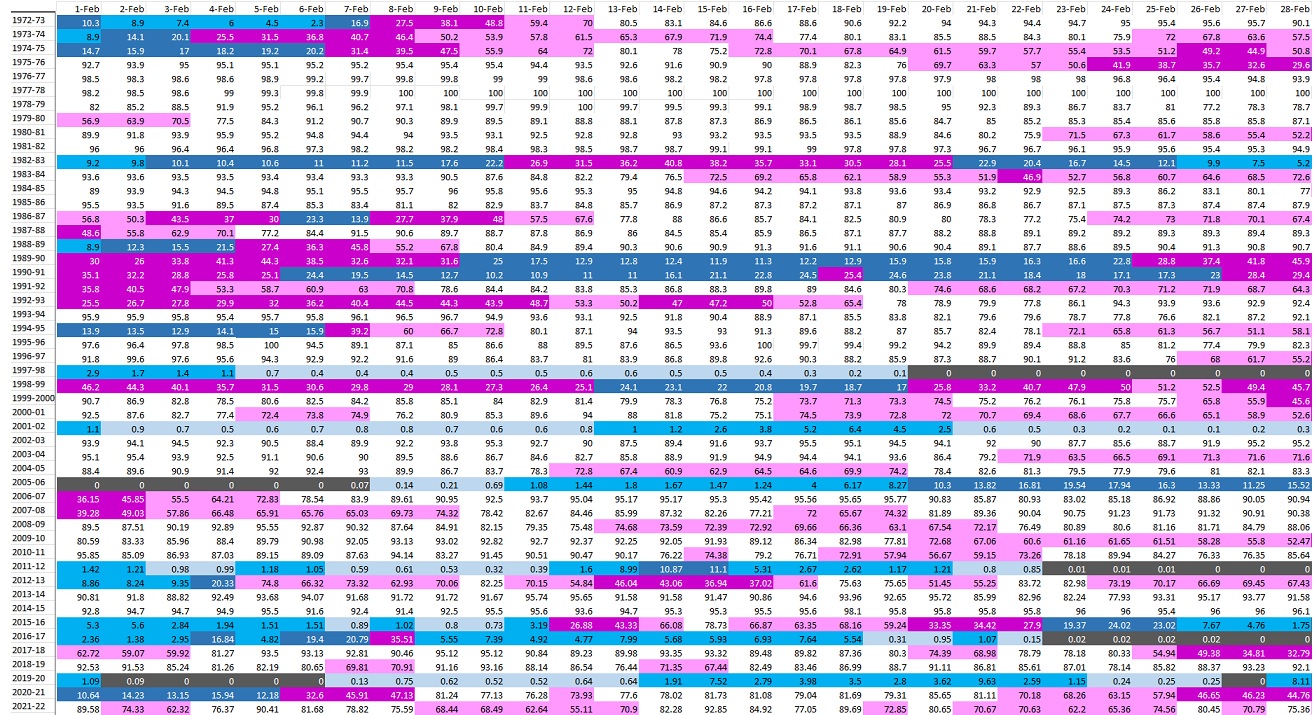
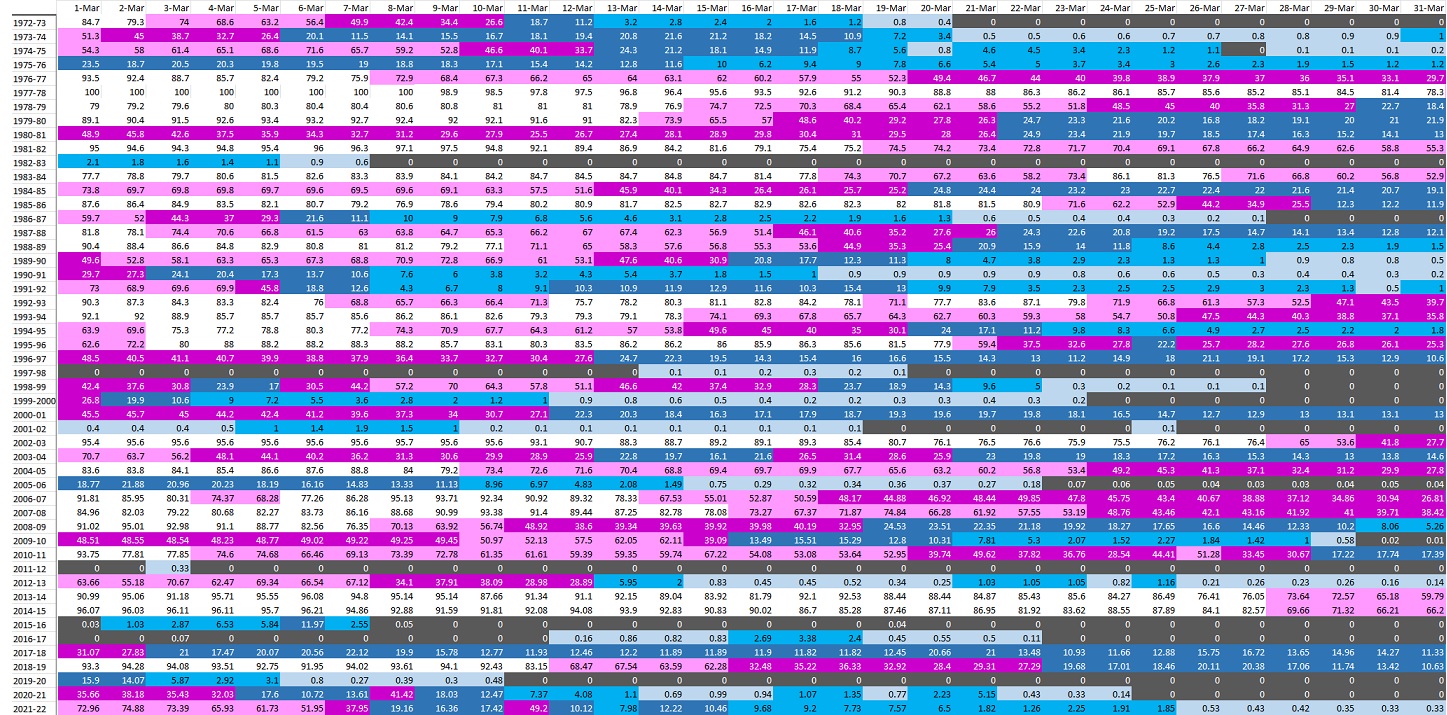
Click to enlarge each image to show the daily ice coverage for NOVEMBER, DECEMBER, JANUARY AND FEBRUARY (THROUGH FEB 4, 2025) each month dating back to 1972


Wednesday, January 18, 2023

Lake Erie Ice Cover Update


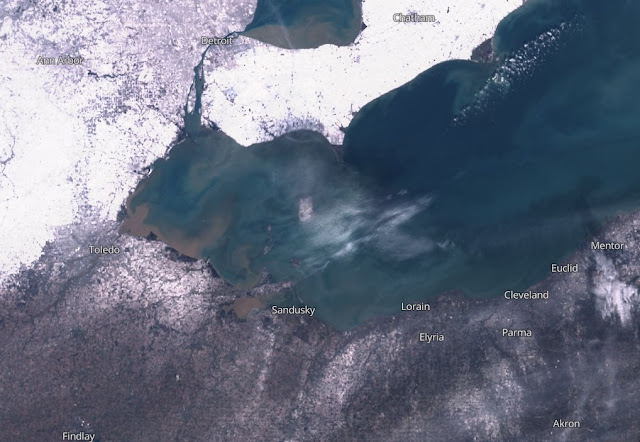
High resolution image of Lake Erie, January 16,2023

I finally updated the daily Lake Erie ice coverage charts for each season since 1972. I separated this into month periods starting with November and ending with May.  This is all color coded. 

  • Light blue blocks indicates ice coverage under 1%
  • Bright blue is 2% to 10%
  • Dark Blue is 11% to 25%
  • Purple is 26% to 50%
  • Pink is 51% to 74%
  • White indicates at least 75% coverage

You'll notice several things here:
  1. Significant ice typically doesn't develop until late December.
  2. Mid/late 1970s AND the early 2000s stand out as the most significant ice coverage period in  January and early Februar
  3. First half of February is typically the peak for ice coverage
  4. November 23, 2014 was the earliest ice cover
  5. May 17, 1982 was the latest ice cover 

Back in 2021 and 2022, I did some research on the conditions needed for rapid ice development.  Links are  HERE  and  HERE


NOVEMBER


DECEMBER


JANUARY


FEBRUARY


MARCH

APRIL


MAY
Number of days with ice coverage 90% or higher:


Number of days with ice coverage 10% or higher (since 2010-11)


All Lake Erie ice data from THIS SITE BACK TO 1972

Graph comparing this year (2022-23) to years past

Canadian ice service for more historical perspective


Max ice coverage each winter


Thursday, January 06, 2022

Lake Erie Ice Coverage Update: Any Chance for Significant Ice?

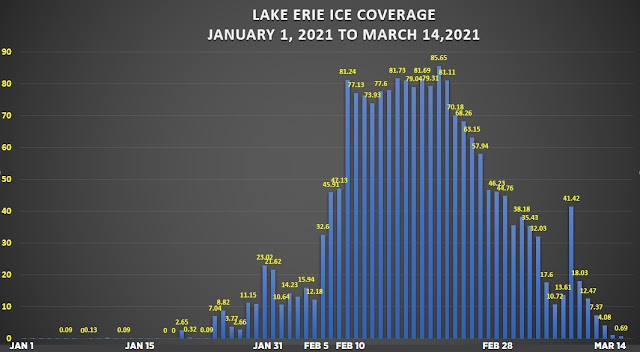
So far no ice has developed on Lake Erie this winter through January 6, 2022. 


The Great Lakes as a whole is void of significant ice.

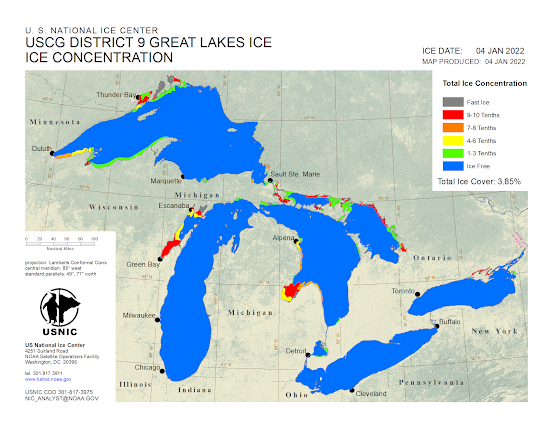
There have been 12 winters (since 1972 when records began) where no Lake Erie ice was reported through January 5. Over those 12 winters, 6 ended up with at least 70% ice coverage for at least 3 weeks later in the winter!


Lake ice development is directly influenced by the duration of cold temperatures.  The longer the temperatures stay cold, the faster and more expansive the ice coverage. 

Last winter I did some research on the years where ice coverage increased rapidly and the temperature conditions that were present for this to happen. 

For example, in 2019 the average temperatures over the period of Lake Erie ice coverage expansion (roughly a 2 week period) was WELL BELOW NORMAL across a large portion of the Great Lakes.

In similar years, the average amount of time of ice coverage expansion from 20% to 80% was roughly 2 weeks.


What are the shortest jumps from 20% to nearly 80% ice coverage?

2/7/1973 to 2/13/1973:    17% to 81% in 6 days
2/6/1995 to 2/11/1995:    16% to 80% in 5 days
1/17/1997 to 1/22/1997:  24% to 77% in 5 days
1/19/2005 to 1/24/2005:  24% to 82% in 5 days
2/4/2013 to 2/10/2013:    20% to 82% in 6 days
2/10/2016 to 2/15/2016:  0.7% to 79% in 5 days

Last year, we had VIRTUALLY NO ICE through the end of January.  Then the early February cold developed and the ice coverage took off!


Look at the temperature vs normal from late January through mid February. It's no wonder the ice started forming this fast.
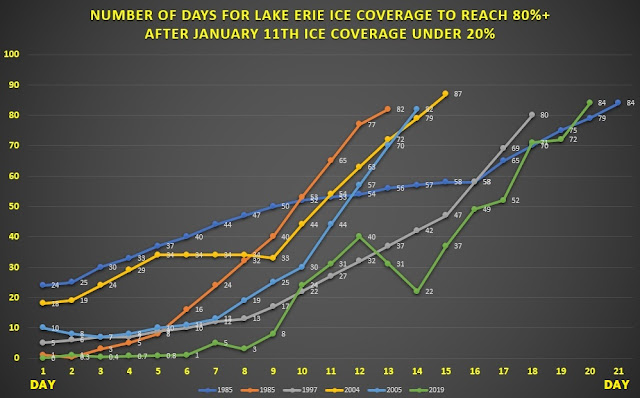
Temperatures vs normal: January 25 to February 23, 2021

The issue this winter as in a few recent winters is the Lake Erie water temperature. The average water temperatures as of January 5 is still around 40 degrees. 


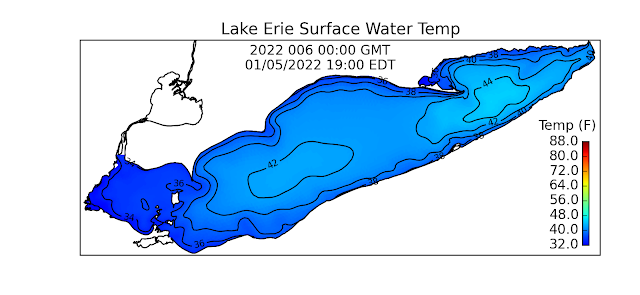
While there are local regions in the mid 30s (western basin) the water temperature overall is well above average.  When we compare this winter to other winters (2020-21, 2015-16, 2011-12 and 2006-07) when the water temperature was around 40 degrees on January 1st, it usually takes a month for the water temps to drop low enough to promote significant ice development.  How fast the current lake water temperature drops will be key this winter!


So what's the take home message from this research?   


* We still have some time to develop ice on Lake Erie

* Water temperature still needs to drop this month

* Ice coverage can significantly expand well into February

* Temperatures need to get significantly colder for at least 10 days (highs in the 20s) to develop significant ice (above 70%).

This has to occur between now and the first 2 week of February

* By mid March, lake ice begins to melt in most winters. Here is the weekly ice coverage for all winters from mid February to mid March:


Wednesday, February 24, 2021

Unbelievable Great Lakes Ice Time lapse

One of the most impressive time lapses I've seen in a long time. This is from WGN-TV Hancock camera earlier this week (February 21). Look how quickly the ice opens up over Lake Michigan as the winds shift and the temperatures rise. If this doesn't cause you to rethink walking on the ice I don't know what will.


Cracks in the ice are VERY common especially this time of year. Fluctuations in air temperature, wind direction and intensity drive the shifting ice making it more unstable.

Ice coverage across the Great Lakes have reached their peak and are now falling.

LAKE SUPERIOR:   51% on Feb 19th

LAKE MICHIGAN:  335 on Feb 18th

LAKE HURON:     48%  on Feb 20th
LAKE ERIE:           86% on Feb 20th
LAKE ONTARIO:  21% on Feb 18th 

Lake Erie, the shallowest of the lakes is showing significant ice breakup.


FEBRUARY 17

FEBRUARY 19

FEBRUARY 21


ANIMATION OF THE ABOVE IMAGES

FEBRUARY 23

The ice movement forecast through early next week.


Compare this year to the last 2 years:


I checked the years since 2000 that had at least 50% ice coverage on March 1st. The average date where we drop to under 25% ice cover is during the last week of March. This is directly connected to the air temperatures. Based on the long range outlook through the first 7-10 days of March, the ice loss should be gradual.


Tuesday, February 02, 2021

Lake Erie Ice Update. Could Lake Ice Shut Down Lake Effect Snow?


Lake Erie ice coverage has bounced from under 5% last week to just over 20% this past weekend. Now its down to 10%.


Crib Cam - February 2, 2021

Ice thickness is mainly under an inch

The water temperature is much lower than 3 weeks ago so it won't take much nudging for ice to develop.


The last time we went from very little ice to over 80% in a week's time was in 2016.

Look at the temperatures vs normal across the US over that period in early February 2016. The high and low temperatures in Cleveland were in the teens and single digits overall.

The forecast temperatures from this weekend through late next week will be WELL BELOW NORMAL across the northern half of the US.  This image looks similar to the one above.


So I would expect Lake Erie ice coverage to increase to 50-60% by next Wednesday minimum.

Here is an experimental forecast from the GLERL (Great Lakes Environmental Research Lab)


Could we see this again along the northcoast before the end of the month?  Could ice cover significantly impact lake effect snow development in the next 2 weeks?  You bet.


Tuesday, January 12, 2021

Will Lake Erie Freeze Over This Winter?

If you live around the Great Lakes especially downwind in wintertime, you probably experience lake effect snow especially during the first half of winter when the lakes are warmer and free of ice. Here in northern Ohio we live on the southern edge of Lake Erie (warmest and shallowest lake) directly in the lake effect snow firing line.  More ice on Lake Erie reduces lake effect snow potential. So each winter by mid January, the same question pops up: Will the lake freeze?

Photo Courtesy:  Scott Sabol February 2013

Let's see how much ice is on the lake right now (as of January 12). Roughly 0.6% 

(Right after Christmas, we reached 1.2% ice coverage on the 27th of December before it melted off)


Ice coverage is well below normal so far (red line is this winter 2020-2021 through 1/11)

For initial clues on where this year's ice coverage might end up, Great Lakes historical ice coverage data (GLERL) might shed some light. This data goes back to 1973. (I wish it went back further). 

The graph below shows the historical ice coverage through January 8th since the early 1970s. 

How many years have had similar (20% and under) ice coverage at this stage of the winter--January 11th?  24 total since 1973.

Which one of those years ended up with more than 80% or more ice coverage? Only 6:  1985, 1997, 2000, 2004,, 2005 and 2019


In these years ice coverage jumped significantly in just a few weeks!


Why did those years develop ice so quickly?  Look at the temperatures vs normal across the Great Lakes and Ohio Valley between January 11th (low ice coverage) and the day when ice coverage reached at least 80% FOR EACH OF THESE 6 YEARS. 

I tabulated the number of days where the high temperatures in Cleveland stayed at/under 32° and the overnight lows stayed at/under 15°.

The below normal cold wasn't just relegated to Ohio. In each year, the cold was widespread over multiple weeks!

1985: Every day was under 32 degrees. Half of nights under 15 degrees


1997: Half of days under 32 degrees. 10 of 13 nights under 15 degrees


2000: 14 of 18 days under 32 degrees. 11 of 18 nights under 15 degrees


2004: 9 of 15 days under 32 degrees. 10 of 15 nights under 15 degrees


2005: 10 of 14 days under 32 degrees. 8 of 14 nights under 15 degrees


2019: Half of days under 32 degrees. Only 8 of 20 nights under 15 degrees

The Lake Erie water temperatures in these years started out well above freezing between January 11 and January 13. By day 10 (January 23) the water temp had dropped to between 32 and 34 degrees...


...It wasn't until the water temperature dropped under 34 degrees between January 21 and 24 that the ice coverage increased.  The ice coverage jump day to day (see below) was significant beyond day 10 once the water temperature dropped and the cold air temperatures were firmly established.  


*  What are the shortest jumps from 20% to nearly 80% ice coverage?

2/7/1973 to 2/13/1973:    17% to 81% in 6 days
2/6/1995 to 2/11/1995:    16% to 80% in 5 days
1/17/1997 to 1/22/1997:  24% to 77% in 5 days
1/19/2005 to 1/24/2005:  24% to 82% in 5 days
2/4/2013 to 2/10/2013:    20% to 82% in 6 days
2/10/2016 to 2/15/2016:  0.7% to 79% in 5 days

In each of these years (with the exception of 2016), the ice coverage remained at around 80% for 3+ weeks

*  The average ice coverage for specific dates between 2010 and 2020:

January 15:    38%
January 20:    40%
January 31:    46%
February 10:  56%
February 20:  50%
March 1:        49%
March 15:      34%
March 31:      17%

Average dates where ice coverage is highest:  February 13-18th

Historically here is the daily ice coverage for each year in January and February. 


Based on the temperature forecast for the remainder of January and into early February, what are the chances the lake freezes over--80% or more?   Pretty small.

We are entering a 2 week stretch through the end of January with periods of colder than normal temperatures.  Based on what I am seeing, on the higher end I think the ice coverage will be between 40-50% by month's end.  In reality I believe it will verify closer to 25%.

Bottom line, Lake Erie will stay open for lake effect snow business into early February!

The first 10-14 days of February will be key to the rest of the winter Lake Erie ice coverage.