
Thursday, July 11, 2019
Late June-Early July Lake Erie Water Temperatures
Quick look at satellite (GLSEA) Lake Erie water temperatures between June 25 and July 10 over the last 10 years


Tuesday, July 09, 2019
Baseball At The All-Star Break vs Last 10 Seasons
Major League Baseball at the All-Star break. Unless otherwise noted, the graphs below shows numbers through the first half of each season (All-star break) since 2010. All data via Fangraphs and Baseball-Reference
First, home runs per plate appearance:

Percentage of ALL BALLS IN PLAY that are Home Runs continue to climb

Percent of Runs that come via Home Runs:

How often are balls put in play? Numbers have been dropping especially since 2015

Baseball's "Three True Outcomes" (Walk, Strikeout and Home Run) continue to rise

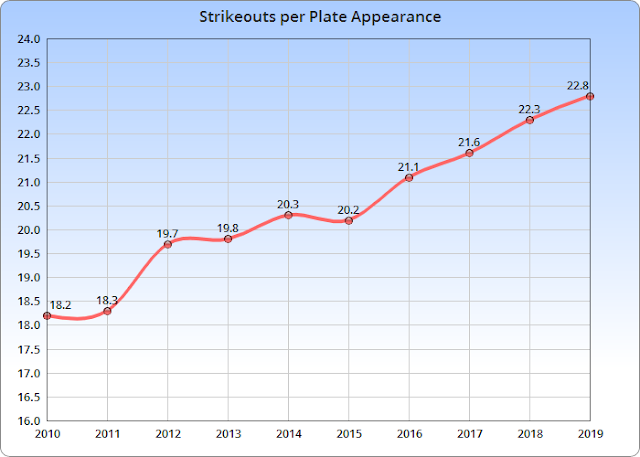
Strikeouts per plate appearance continue to climb:


First, home runs per plate appearance:

Percentage of ALL BALLS IN PLAY that are Home Runs continue to climb

Percent of Runs that come via Home Runs:

How often are balls put in play? Numbers have been dropping especially since 2015

Baseball's "Three True Outcomes" (Walk, Strikeout and Home Run) continue to rise

Strikeouts per plate appearance continue to climb:

Strikeouts AND Walks per plate appearance:

As expected, league wide ground ball rates are falling:

Yet flyball rates are steady over the last 3 years:

Flyball Power numbers (Slugging Pct) have increased this season as Flyball rates have stabilized.
 |
| Season Totals |
Power numbers (Slugging Pct) have also increased AFTER 2 STRIKES
 |
| Season Totals |
53% drop since 2011 in Sacrifice Hits
 |
| Season Totals |
Defensive shifts continue to rise (data via Fangraphs)

Wednesday, June 26, 2019
Flood Warnings Through June 25th
Issuance numbers for each NWS forecast office from January 1 through June 25 each of the last 10 years. Note that the colorized legend changes for each year depending on the range.
Which weather service office leads the pack this year? NWS Indianapolis with 343. The most of any office through June 25th since 2010
NWS Cleveland Flood Warning count


Which weather service office leads the pack this year? NWS Indianapolis with 343. The most of any office through June 25th since 2010
NWS Cleveland Flood Warning count


Saturday, June 22, 2019
Long Range Forecast Ideas FIRST HALF OF JULY
One of the drivers we look at in determining our long range outlooks 2-3 weeks down the road is the daily changes in the Southern Oscillation Index.

Here is a great description of the SOI from NOAA:
Over the last 3 days the SOI changes have been significant. A large drop occurred between June 20-22nd. (See this site for the graph).
Looking at the long range composites during similar drops in summer (during an El Nino which we are still in albeit weak) shows this 500mB pattern between July 7th and July 16th.

Warmer shades indicate high pressure. Notice the lack of sustainable high pressure in the middle of the US and central Canada. It tries to develop but flattens out.
This is not the only driver of this pattern to be sure. But this DOES point to several things:
> The dominant middle US storm track shows up again (shades of blue and purple which indicate low pressure) with frequent storm systems and frequent rainfall.
> Big difference is that these storm systems will tend to feature less large scale rain. Storms will be more localized. Daytime warmth/higher humidity will fuel storms more than in May and June
> The normal high temperatures across much of the central US/Ohio Valley in July is lower 80s NOT the 70s like it was in late May/early June.
> Lack of long stretches of heat (90s) in the first half of July (central US east into New England) and possibly longer. Periods of below normal temperatures
> Through mid July Near normal rainfall in Ohio back into Pennsylvania--slightly above normal in spots--corn belt (Nebraska east into the Great Lakes)

Here is a great description of the SOI from NOAA:
"The Southern Oscillation Index (SOI) is a standardized index based on the observed sea level pressure differences between Tahiti and Darwin, Australia. The SOI is one measure of the large-scale fluctuations in air pressure occurring between the western and eastern tropical Pacific (i.e., the state of the Southern Oscillation) during El Niño and La Niña episodes. In general, smoothed time series of the SOI correspond very well with changes in ocean temperatures across the eastern tropical Pacific. The negative phase of the SOI represents below-normal air pressure at Tahiti and above-normal air pressure at Darwin. Prolonged periods of negative (positive) SOI values coincide with abnormally warm (cold) ocean waters across the eastern tropical Pacific typical of El Niño (La Niña) episodes"The Australian Bureau of Meteorology site is another great resource
Over the last 3 days the SOI changes have been significant. A large drop occurred between June 20-22nd. (See this site for the graph).
Looking at the long range composites during similar drops in summer (during an El Nino which we are still in albeit weak) shows this 500mB pattern between July 7th and July 16th.

Warmer shades indicate high pressure. Notice the lack of sustainable high pressure in the middle of the US and central Canada. It tries to develop but flattens out.
=========================
This is not the only driver of this pattern to be sure. But this DOES point to several things:
> The dominant middle US storm track shows up again (shades of blue and purple which indicate low pressure) with frequent storm systems and frequent rainfall.
> Big difference is that these storm systems will tend to feature less large scale rain. Storms will be more localized. Daytime warmth/higher humidity will fuel storms more than in May and June
> The normal high temperatures across much of the central US/Ohio Valley in July is lower 80s NOT the 70s like it was in late May/early June.
> Lack of long stretches of heat (90s) in the first half of July (central US east into New England) and possibly longer. Periods of below normal temperatures
> Through mid July Near normal rainfall in Ohio back into Pennsylvania--slightly above normal in spots--corn belt (Nebraska east into the Great Lakes)
Tuesday, June 18, 2019
Updated Rainfall vs Normal
Rainfall vs normal last 60 days across Ohio Valley and Midwest

Rainfall vs normal last 14 days

Ohio Valley rainfall last 72 hours (June 15 morning thru June 18 morning)


Updated rainfall numbers at NWS Cleveland (Hopkins Airport)


Rainfall vs normal last 14 days

Ohio Valley rainfall last 72 hours (June 15 morning thru June 18 morning)


Updated rainfall numbers at NWS Cleveland (Hopkins Airport)

Wednesday, June 05, 2019
Mid to late June 2019 Outlook
We start with the northern Pacific:
The pressure patterns show a pretty consistent storm track off of Asia east into the northern Pacific undercutting the Bering Sea high as of June 4th.


Superimposing the US over the Bering Sea region--Bering Sea Rule--you can see how the actual storm track line up with the continental US down the road--8 days and 16 days out. A fairly persistent eastern US trough with the central US high pressure ridge.


This pattern is pretty different from the late May pattern which featured the SE ridge east and the central US trough which drove the heavy rainfall across the corn belt.

 Another interesting feature has been the "Greenland Block". We noticed this earlier in May. A high latitude block like this does what it's name says. It block the pattern thus the heavy rain/high soil moisture content this spring.

This Greenland Block can't be ignored this month. Notice how the high over Greenland continues through mid month. The trough redevelops over the eastern US.
 The daily SOI changes (Southern Oscillation Index--difference in pressure pattern between Darwin and Tahiti) offer some additional insight.

There have been some decent rises and falls over the last week.
SOI rises similar historically correspond to short-lived high pressure over the eastern US at day 17, 20 and 23. Notice on day 23, it also shows a southern low over Texas.
SOI drops historically show these pressure patterns:
Notice the eastern ridge is further off the coast and an Ohio Valley low with a central US ridge...
 Day 20 analog show the ridges pretty strong with the Ohio Valley low breaking down a bit...

Day 23 shows the lingering southern US/Ohio Valley low with high pressure continuing to flank it.

While these rises and falls show some conflicting signals, the idea for a southern storm position between the 24th and the 27th seems pretty good. Long range projections show pretty good agreement on well above normal rainfall across the southern states over the next 14-17 days. I believe this trend will continue into the last week of the month.

In summary, this is how I envision the next 3 weeks overall:
* Storm track takes a southern route heading into mid June/3rd week of the month.
* Small periods of heat but nothing sustainable through June 20th
* June 5-9: Temperatures near normal/slightly above
* June 10-14: Temperatures below normal
* June 6-14: Rainfall near normal with longer breaks in between weather systems
* June 15-20: Temperatures near normal. Little chance of any extreme heat (90+) or long stretches (3-5 days+) of 85-90 degree heat
* June 20-27: Temperatures near/slightly above normal.
How do we derive these long range outlooks? Here is brief explainer with a few other links:
* Outlooks are different than day-to-day outlooks
* Summer Outlook Elements From 2015
* Why We Dismiss Science So Easily?
* Evolution and Devolution of Social Media Comments
The pressure patterns show a pretty consistent storm track off of Asia east into the northern Pacific undercutting the Bering Sea high as of June 4th.


Superimposing the US over the Bering Sea region--Bering Sea Rule--you can see how the actual storm track line up with the continental US down the road--8 days and 16 days out. A fairly persistent eastern US trough with the central US high pressure ridge.


This pattern is pretty different from the late May pattern which featured the SE ridge east and the central US trough which drove the heavy rainfall across the corn belt.


This Greenland Block can't be ignored this month. Notice how the high over Greenland continues through mid month. The trough redevelops over the eastern US.


There have been some decent rises and falls over the last week.
SOI rises similar historically correspond to short-lived high pressure over the eastern US at day 17, 20 and 23. Notice on day 23, it also shows a southern low over Texas.
 |
| DAY 17 after RISE |
 |
| DAY 20 after RISE |
 |
| DAY 23 after RISE |
Notice the eastern ridge is further off the coast and an Ohio Valley low with a central US ridge...


Day 23 shows the lingering southern US/Ohio Valley low with high pressure continuing to flank it.

While these rises and falls show some conflicting signals, the idea for a southern storm position between the 24th and the 27th seems pretty good. Long range projections show pretty good agreement on well above normal rainfall across the southern states over the next 14-17 days. I believe this trend will continue into the last week of the month.

In summary, this is how I envision the next 3 weeks overall:
* Storm track takes a southern route heading into mid June/3rd week of the month.
* Small periods of heat but nothing sustainable through June 20th
* June 5-9: Temperatures near normal/slightly above
* June 10-14: Temperatures below normal
* June 6-14: Rainfall near normal with longer breaks in between weather systems
* June 15-20: Temperatures near normal. Little chance of any extreme heat (90+) or long stretches (3-5 days+) of 85-90 degree heat
* June 20-27: Temperatures near/slightly above normal.
How do we derive these long range outlooks? Here is brief explainer with a few other links:
* Outlooks are different than day-to-day outlooks
* Summer Outlook Elements From 2015
* Why We Dismiss Science So Easily?
Friday, May 24, 2019
Does Late May Team wOBA Indicate Team's Post Season Chances?
Here are the wOBA ranks for each of the last 10 season at the end of May. (Fangraphs has an excellent tutorial on their website on what wOBA is an why this statistic is much better than batting average or on-base percentage)
Red teams indicate AL teams that made it to the post season. Blue teams National League. "W" are wild card teams:
While there are certainly some exceptions (total of only 5 teams) 81 of the 86 teams that have made the playoffs in the last 10 years have had better wOBA than the Indians as of this writing.
Unless the Indians offense gets better at the chances of them making the playoffs are extremely Slim.
Red teams indicate AL teams that made it to the post season. Blue teams National League. "W" are wild card teams:
While there are certainly some exceptions (total of only 5 teams) 81 of the 86 teams that have made the playoffs in the last 10 years have had better wOBA than the Indians as of this writing.
Unless the Indians offense gets better at the chances of them making the playoffs are extremely Slim.
 |
| 2010 wOBA ranks |
 |
| 2011 wOBA ranks |
 |
| 2012 wOBA ranks |
 |
| 2013 wOBA ranks |
 |
| 2014 wOBA ranks |
 |
| 2015 wOBA ranks |
 |
| 2016 wOBA ranks |
 |
| 2017 wOBA ranks |
 |
| 2018 wOBA ranks |
 |
| 2019 wOBA ranks |
Subscribe to:
Posts (Atom)