Friday, December 24, 2021

Why Was December So Mild? A Look Into January

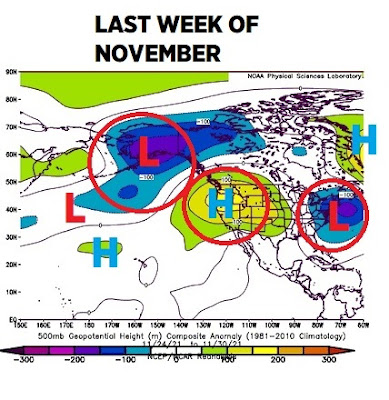
Check out the upper level pattern in November. The red areas are high pressure. Blue areas low pressure. Notice how progressive the storms systems were. Temperatures were colder than normal. No definitive regions of high pressure (blocks) locking in a long stretch of cold or warm. 

The last week of November showed no Pacific ridge locking this pattern into place.  Look at the low over Alaska and the low off the east coast. 

Around that time, the Pacific was giving us signals of warmth for December.  Here is the long range outlook I published on November 23rd


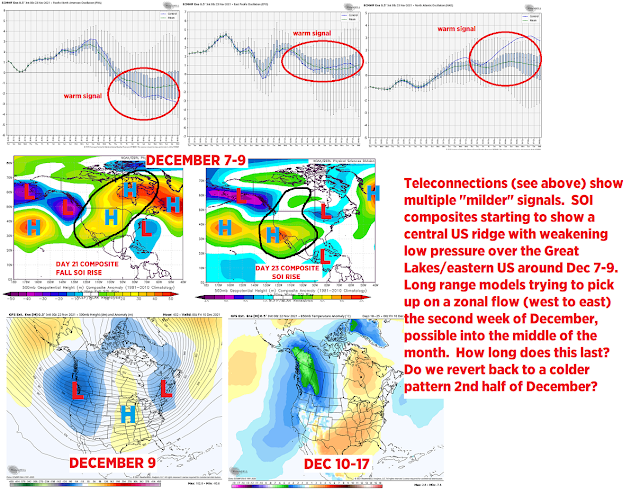
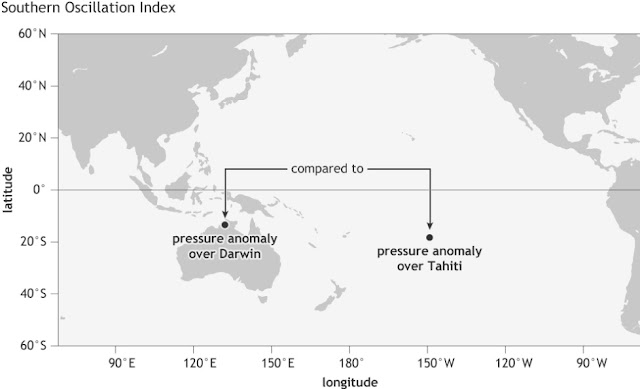
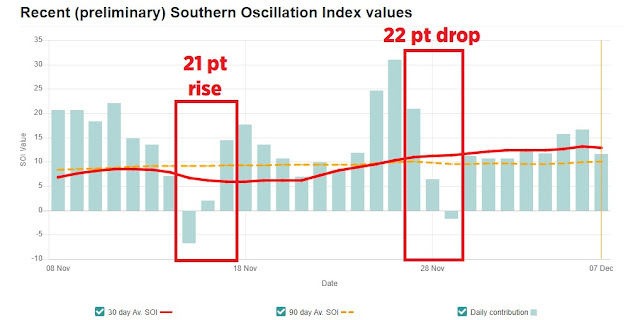
The SOI (southern oscillation index) was signaling, around the same time, the same warmth with brief cooler interruptions. 


The actual upper level pattern started to change in early December. Western Pacific ridge was popping.  All of this develops in a response to the La Nina background state. BLUE REGION in the middle


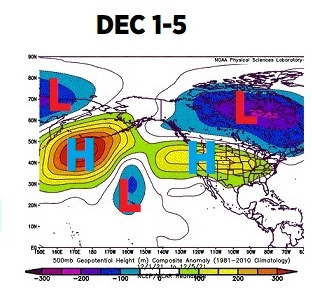
By the second week of December, the low retreated into Canada. The Pacific ridge and east coast ridge was building.
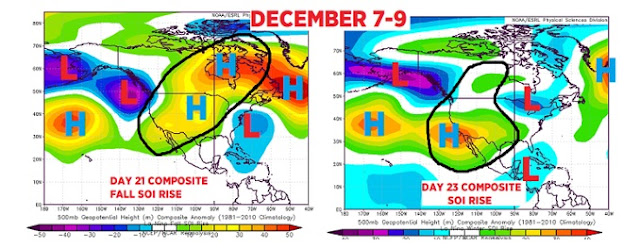
DECEMBER 6-10

By the middle of December, two separate high pressure ridges developed.  The main ridge over the northern Pacific.  The other over the eastern US with a western trough.

DECEMBER 11-15
The third week of December featured the strengthening Pacific ridge as the eastern US ridge shifted south.
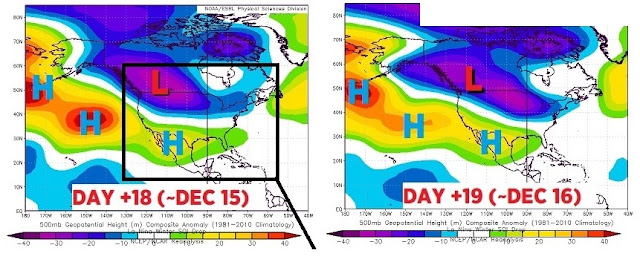
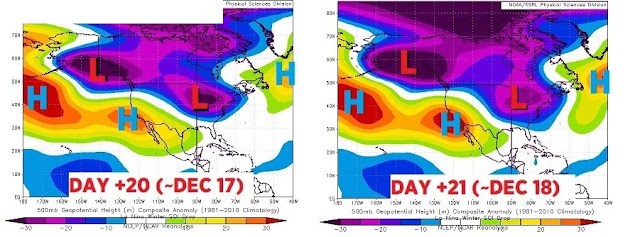
DECEMBER 16-20

December as a whole shows each ridge dominating the pattern.
DECEMBER 1-20


Look how the daily temperatures progressive throughout the month. A few brief colder intrusions but nothing sustainable. 

As of this writing on Christmas Eve, the pattern still shows the HUGE Pacific ridge not budging as the SE ridge settles in.


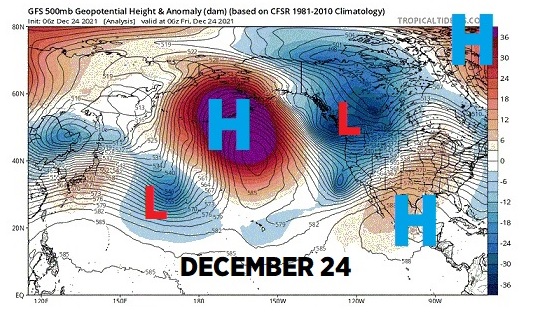
What does this mean overall?  Milder temps continue through the remainder of the month. Models show the SE ridge weakening a bit as we head into January. 


Overall our confidence in increasing for a dominant panhandle storm track in January.  This would feature rain/snow mix type systems from Oklahoma then northeast into the Ohio Valley.


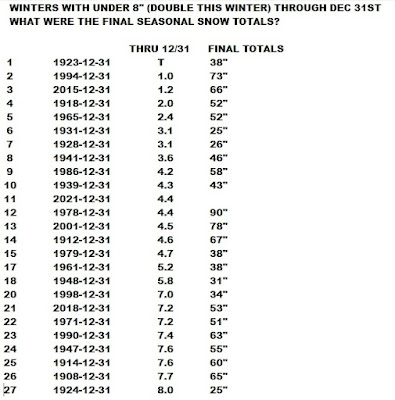
December 2021 has only a trace of snow!  Only two other Decembers have had just a trace of snow.  1931 and 1923.  Just for fun, what was the final winter snowfall after snow totals under 8" through the end of December?


Tuesday, December 14, 2021

Deadly December Tornado Outbreak Recap

The clean up continues across the south after Saturday's deadly tornado outbreak.


people lost their lives as 71 tornadoes hit after dark between  December 10 and 11 across parts of 4 states. This LINK HERE lists multiple resources on the damage assessments.


More than 48 hours prior to the event, the Storm Prediction Center started to plant the seeds of potential severe weather.


By Friday, the SPC narrowed and upgraded their outlook from Enhanced to Moderate:


Chicago NWS graphic below shows the HUGE differences in temperature.


The severe storm parameters were present. Graph from NWS Little Rock, AR.


Storms were building in the distance.  Notice the sunshine ahead of the storms. This can create a false sense of security.

Nathan Scott, Little Rock, AR

Look at the wide variation in weather occurring simultaneously on December 10-11.  Winter weather watches across the upper midwest.  Rapidly deteriorating conditions in the south as the line of severe storms tracked east.  Notice the tornado watches/warnings in red.


This line which evolved into two separate lines produced large scale damage from western Ohio to southern Arkansas.


Meteorologists at the SPC and the various other NWS offices across the central US did an amazing job in giving advanced warning. Look at the accuracy of the outlook vs the tornado reports.


Total path exceeded 200 miles


This outbreak could end up breaking the tornado track record set back in 1925


For perspective, here is a map of the tornado outbreak in April 1974


More details will be forthcoming on the strength of the tornadoes. Here is the list and locations of ALL EF4 & EF5 tornadoes.  The last EF5 was May 2013.


Tuesday, December 07, 2021

December Warmth is Coming. So When Did We Know?


For several years, I've been implementing a variety of research in creating long range outlooks for the Ohio Valley and Great Lakes on the 18-21 days time scale. In fact last year, almost a year to the day, I issued a long range December outlook using the same techniques highlighting a panhandle snow track on the 8th  (Outlook was dead on. The percentage was too low)   CLICK HERE FOR THE POST 

One of the variables I use is daily changes in the Southern Oscillation Index (SOI).

The SOI is the different in pressure between Darwin, Australia and Tahiti.

Look at the daily SOI values since early November.  Notice the period where the SOI rose near 20 points over a 2 day period and a drop of more than 20 points. First period was Nov 15-17, the second was Nov 14-16.


The sharper the change (rise or drop) the greater the effects in other parts of the world. Meteorologist Joe Renken was instrumental in doing the research showing what these changes mean 2-3 weeks days in the future across North America in different seasons and different ENSO states (El Nino, Nada or La Nina).  You can read the paper HERE. 

The first sharp SOI rises above yielded these upper level composites in similar seasons/conditions. Notice the ridge in the central US and the lingering Great Lakes/Eastern US low pressure.  I posted this a week before Thanksgiving. The seeds were for the December warmth were planted here.

SOI composite: Day 21 & 23 ahead

The SOI drop (right red box above) gave us these composites.


You can see the high pressure/warmth across the southern states.  What's also apparent is the lingering low pressure from the British Columbia coast east along the US/Canadian border and into the Great Lakes. A big indicator that Clipper Systems and short-lived intrusions of cold will interrupt the warmth. We have already seen this up & down pattern in reality thus far since Thanksgiving.  Remember that this pattern was indicated in late November.

The actual computer model output (GFS) on November 29 mirrored the composites!


So what did all of this SOI analysis before Thanksgiving tell us about the mid-December outlook?  It tells us that above normal temperatures were coming. We'd have brief interruptions of cold with local snow from time to time before the longer lasting period of "warmth" around the middle of the month. As of this writing (December 7) I still think we will see a 60 with sun BEFORE Christmas week!

The current model output (December 7th) shows the warmth finally popping across the eastern US. Loop is from Dec 7 to December 22.  

Our northern Ohio 8 day forecast illustrates the up and downs.


Note that the SOI was only one of several other variables (not mentioned here) were used in creating the mid December outlook. 

Who says we can't predict the weather 20 days in advance!

Any questions send me an email:  scott.sabol@fox8.com

Thursday, December 02, 2021

November 2021 Recap: Where Did The Temperatures End Up?


After a super warm October around most of the country, November featured more periods of "cold" across the eastern US.

First the October temperatures vs average


Now the November temperatures vs average (US)


Breaking down November into weekly periods you can see how variable the temperatures were as the split jet stream shifted week to week.  First week was colder than normal (lower left) across eastern US. The cold backed off the second week as the jet weakened as it lifted back into central Canada (upper right)


Third week featured the return of the northern jet across the northern states (upper left below) with colder periods more frequent (lower left).  By November 16-18, southern jet became stronger with a more uniform northern jet more southeast. The result was warmer temps out west with more sustained colder temps eastern US (lower right)


A close up look at the northern US/Great Lakes shows the sharp contrast between temperature regimes.

Max temperatures & Minimum temperatures vs average. 


So far most of the lake effect communities across the Great Lakes have had slightly above normal snowfall.

Overall snowfall across the US is below last year


Next post we'll take a look at what December is looking like!