Remember the active spring we had? Seems like it was years ago.
Most of northern Ohio had between 1/2" and 2"+ rainfall above normal during the first half of June. The driest areas were eastern Geauga, Lake and most of Ashtabula counties.
 |
| June 1-15 Rainfall vs Normal |
Since the wetter stretch of weather in early June, rainfall has been sparse. Most of the area was running 1-2" below average since June 15th. This was in our long range forecast issued back on June 18th. Rainfall map is below.

Rainfall looking well below normal through the end of June and possibly beyond @fox8news pic.twitter.com/WtsxsqVDD1
— Scott Sabol, Meteorologist CBM/CCM (@ScottSabolFOX8) June 18, 2022
 |
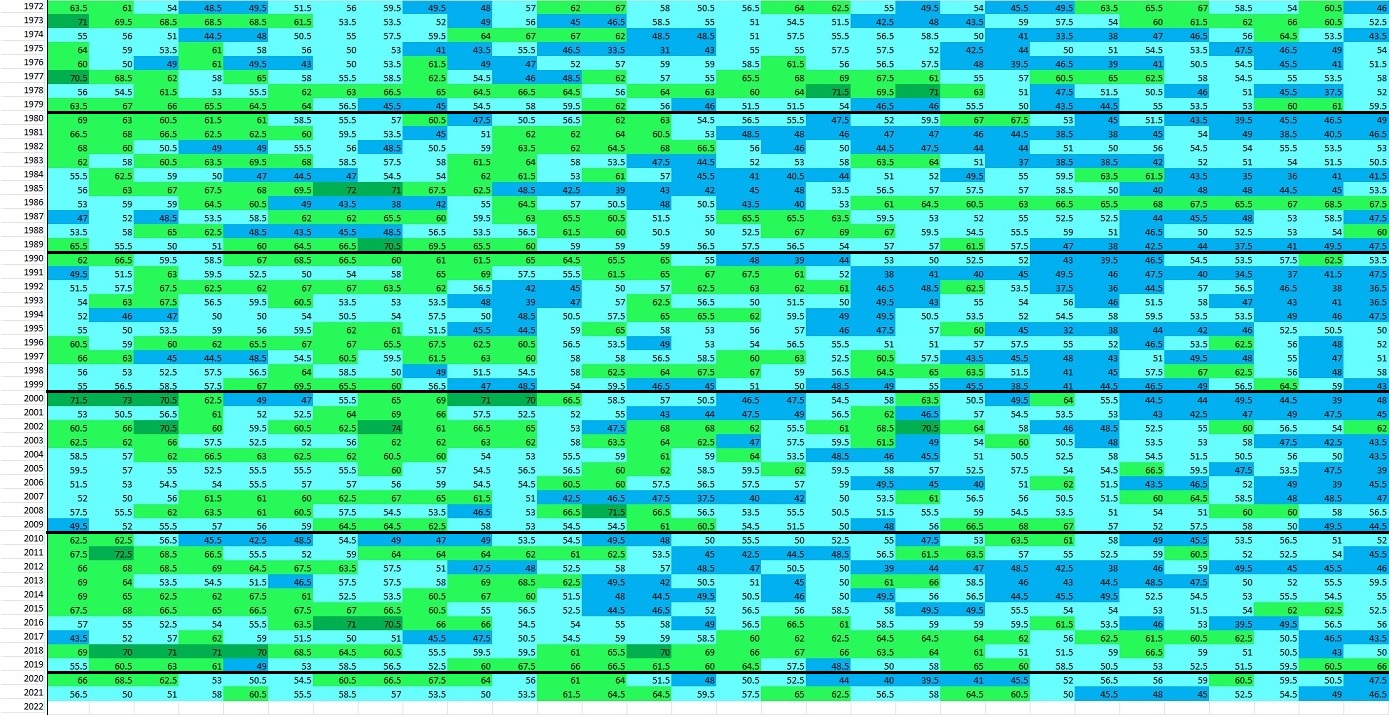
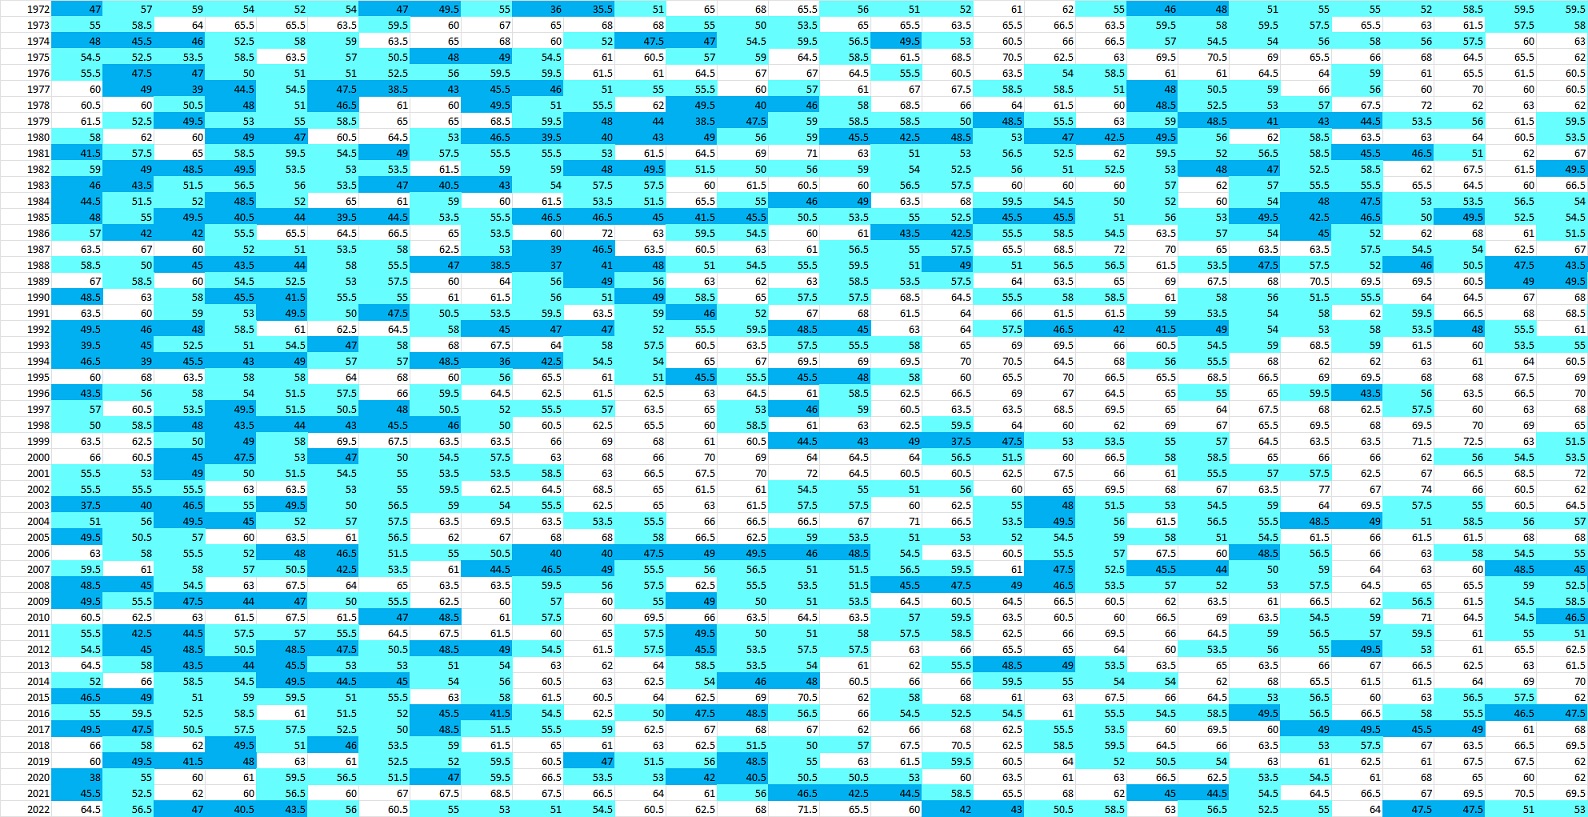
| June 15-30 Rainfall vs Normal However since the start of July, the pattern has reverted back to a spring one albeit briefly. Storm track has brought rain/storms in from the West-Northwest. Below is the July 1-6 rainfall vs normal.  Let's break down the actual rainfall amounts over 3 day periods. I circled the regions where rainfall is between 0.75" and 1.25"  Now July 4 through early July 6th. Circled regions show rainfall between 0.75" and 1.5" and 2-3". Notice the extremely dry conditions across Lake, portions of Geauga and Ashtabula counties. 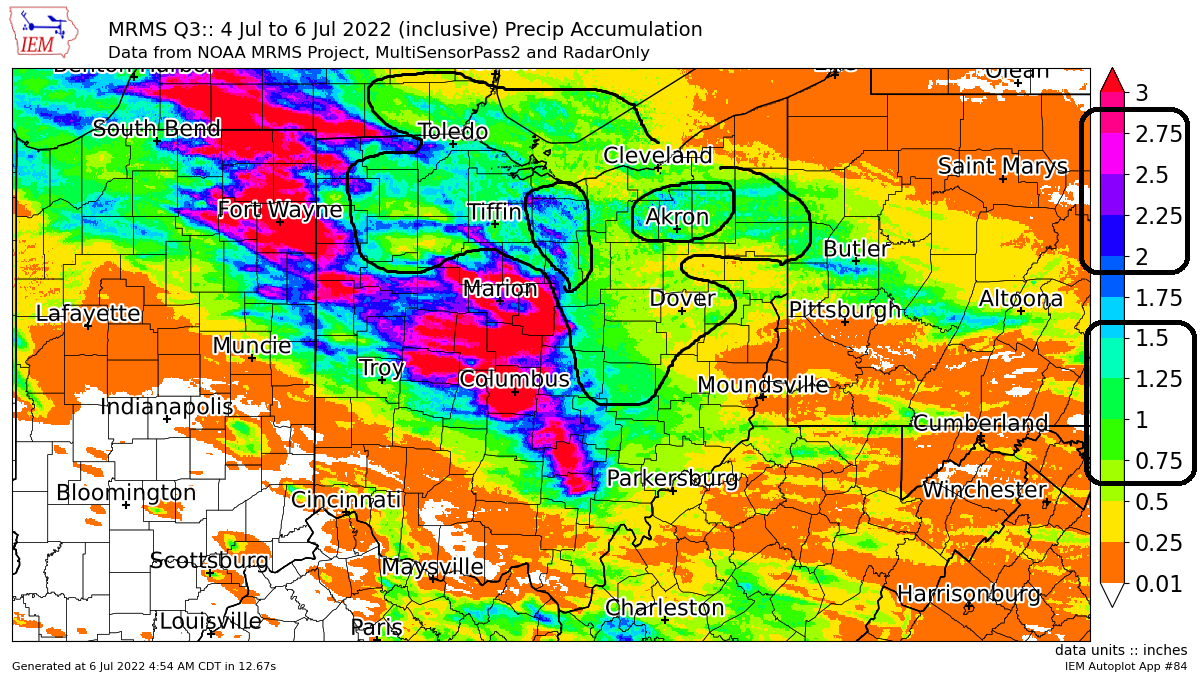 The soil moisture has dropped significantly across the Ohio Valley since mid June. Recent rainfall will help. Duration of rain is key. Since these storms have moved fast, much of rain runs off instead of being absorbed into the ground. .gif) Long range forecast shows rain this week. Beyond Saturday July 9, rainfall remains well below normal through July 19th!  |