Showing posts with label high humidity. Show all posts

Tuesday, July 22, 2025

Is This Summer's High Humidity Unique?


It seems like we haven't had much of a break from the high humidity across northern Ohio. It turns out that this summer SO FAR is the most humid summer on record in northern Ohio!

Here is the list (thru July 19):

  1. 2025
  2. 1995
  3. 1949
  4. 1987
  5. 1999
  6. 1973
  7. 1943
  8. 2010
  9. 1989
  10. 2018


The month of June started off somewhat cool and pleasant. The first two weeks of June featured several short periods of higher humidity (dew points above 60) with sharp drop-offs each time. The second half of the month saw a huge jump in humidity with a long stretch with dew points close/slightly above 70 degrees. Since the first of July, the breaks (dew points under 60) have been few and far between.

Compare this year to last year over the same time period. We had many more breaks from the high humidity.


Why has it been so consistently humid vs last year? The 500 mB reanalysis sheds some light on this. Notice the position of the highs and lows last year in the first half of summer. Ridge off the east coast did help increase the humidity from time to time. The deeper trough in the northern US suppressed the northward movement of moisture with a more dominant NE flow aloft across the Ohio Valley.

This year is different. The high pressure ridges are a bit further north as is the northern US trough. Couple this with a weaker but persistent trough over the southern plains and you have a more dominant south/southwesterly flow across the central US and Ohio Valley.

The long range outlook heading into early August is for the higher humidity (green colors) to shift into the central US and away from the southern Great Lakes.


Tuesday, July 05, 2022

Are Summers Becoming More Consistently Humid/Less Breaks?


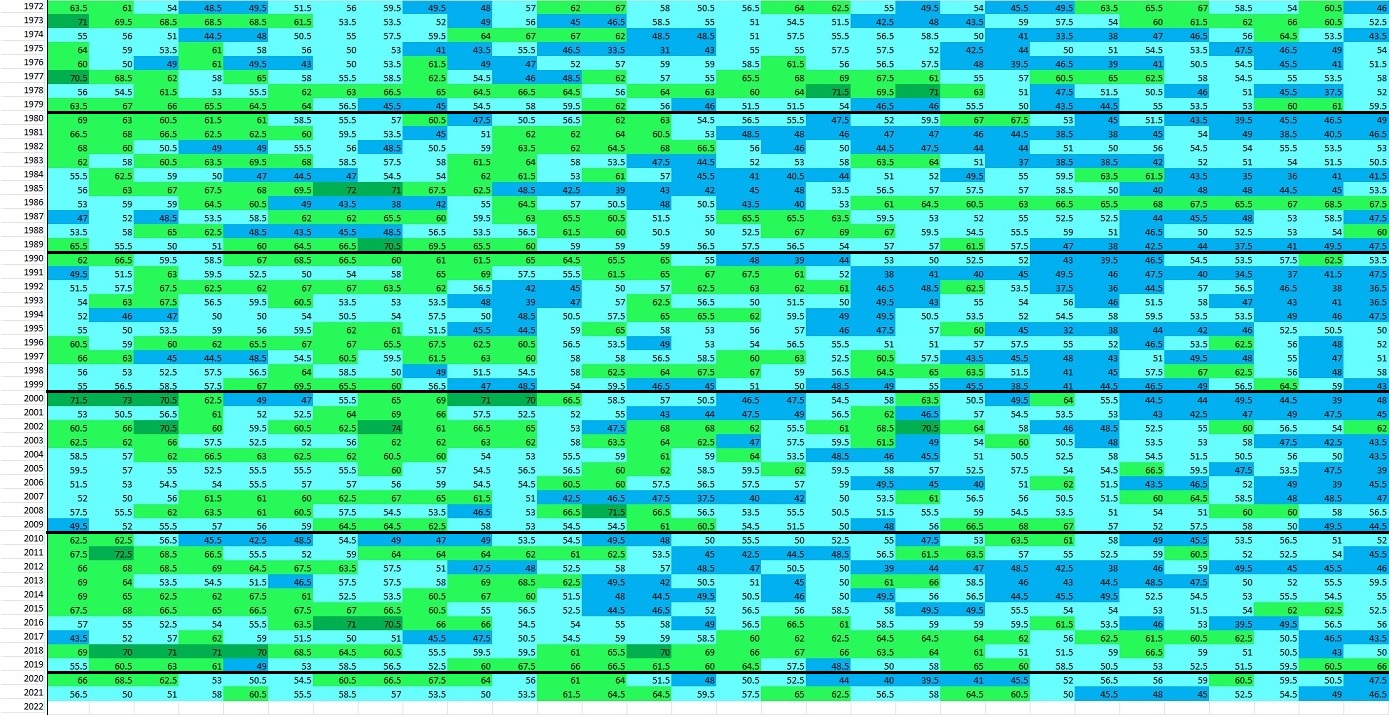
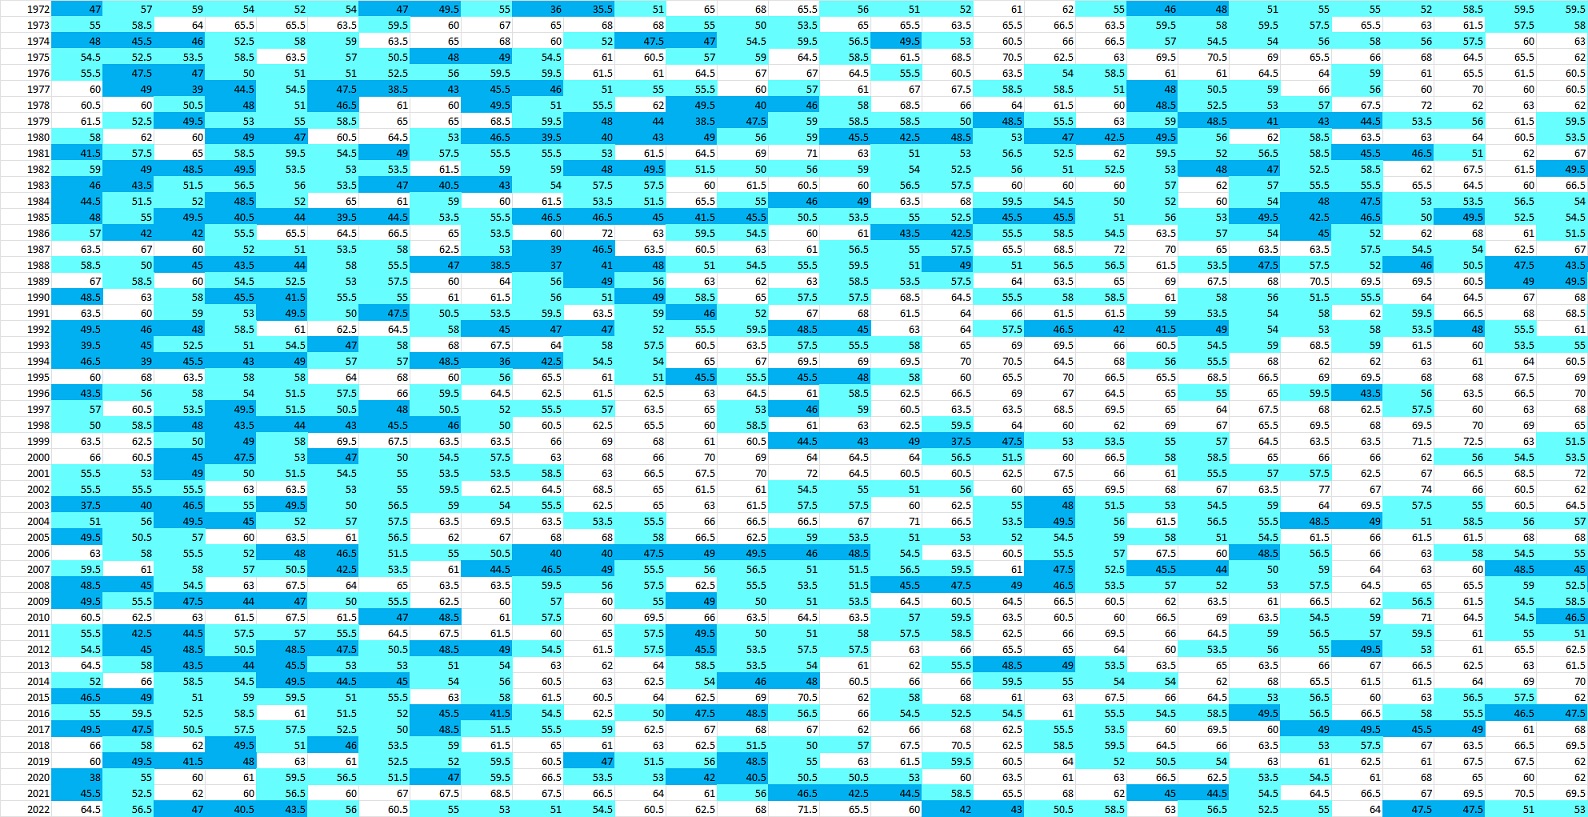
The plots below are the average dew point for each day from June 1 to September 30 since 1972 for Cleveland. I color coded each dew point range for easy reference.

Dark Blue: 30-49°

Light Blue:  50-59°

Light Green:  60-69°

Dark Green:  70-80°

First image is the month of June. Reading left to right for day one through 30. Horizontal black line separates each decade. I notice more breaks from high humidity days in the 1970s and 1980s. More consistently high humidity in the mid/late 1990s into the early 2000s. Recently, lower humidity days seem more frequent in the first half of the month


Second image is July. Over the last 10-15 years the frequency of "lower humidity" days (light blue) seems less than previous decades.


Third image is August


Fourth image is September:


Let's only display the days with dewpoints UNDER 60.  Basically more comfortable days. Now we can see the frequency of delightful days for each summer month/day.  Some quick observations:

* Breaks in the humid days in June look to be more frequent in the 1970s/80s and early 2000s
* Breaks in humid days in July more frequent in the 1970s, early 80s and early 2000s.
* Breaks in humid days in August more frequent in the 1970s.
* Breaks in humid days in early September more frequent in 1970s and 1980s

JUNE DEWPOINTS SINCE 1972 (UNDER 60)


JULY DEWPOINTS SINCE 1972 (UNDER 60)


AUGUST DEWPOINTS SINCE 1972 (UNDER 60)


SEPTEMBER DEWPOINTS SINCE 1972 (UNDER 60)

Monday, June 06, 2022

How Humid was Last Summer? A Look At This Summer


Last August I wrote about the summer humidity at that point in the summer (You can read about it HERE). So I figured I'd revisit the topic now with last summer's final ranking.

It turns out that SUMMER 2021 was the 4th most humid summer since 1948 followed by 2010 at #3, 2018 at #2.  What summer is #1?  1995


Was last summer (2021) ranked #4 because we had an abnormally high number of days with dewpoints in the 70s?  Probably not. The next graphic shows the number of hours for each year we reached a dewpoint of 70+.  

There were 21 other years with more than 2021!  So what was special about the humidity last summer?  It was consistently humid with very little breaks.  

The number of hours with a dewpoint BELOW a dewpoint of 60 really tells the story.  Only 5 years had fewer hours with dewpoints under 60!  1973, 1987, 1995, 2010 & 2018.   Basically last summer we had far fewer breaks.


Our summer outlook for 2022 highlighted a slow start to summer.  So far as of this writing (June 6) the number of hours with dewpoints above 70 is ZERO!  


Last summer at the end of June we had 71 total hours so we have a long way to go to catch up to last year.  Remember it's early