Showing posts with label dew point. Show all posts

Tuesday, July 05, 2022

Are Summers Becoming More Consistently Humid/Less Breaks?


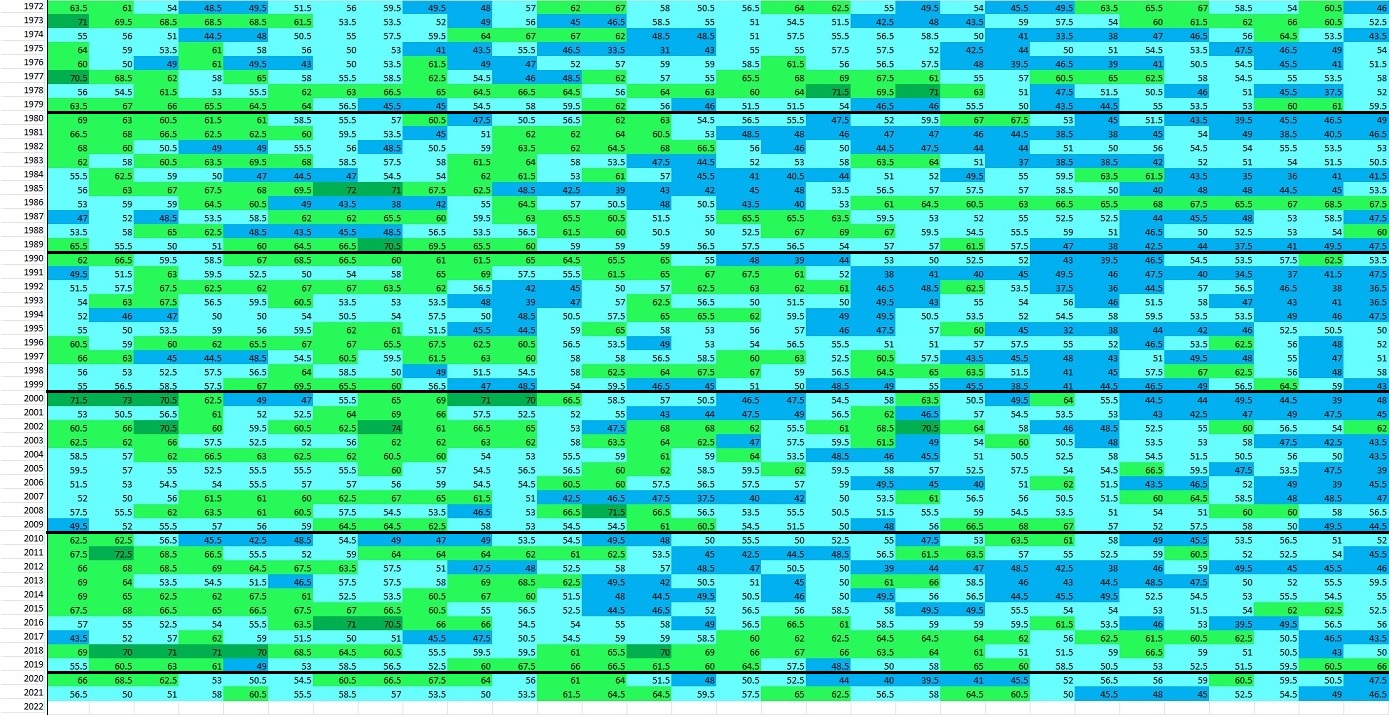
The plots below are the average dew point for each day from June 1 to September 30 since 1972 for Cleveland. I color coded each dew point range for easy reference.

Dark Blue: 30-49°

Light Blue:  50-59°

Light Green:  60-69°

Dark Green:  70-80°

First image is the month of June. Reading left to right for day one through 30. Horizontal black line separates each decade. I notice more breaks from high humidity days in the 1970s and 1980s. More consistently high humidity in the mid/late 1990s into the early 2000s. Recently, lower humidity days seem more frequent in the first half of the month


Second image is July. Over the last 10-15 years the frequency of "lower humidity" days (light blue) seems less than previous decades.


Third image is August


Fourth image is September:


Let's only display the days with dewpoints UNDER 60.  Basically more comfortable days. Now we can see the frequency of delightful days for each summer month/day.  Some quick observations:

* Breaks in the humid days in June look to be more frequent in the 1970s/80s and early 2000s
* Breaks in humid days in July more frequent in the 1970s, early 80s and early 2000s.
* Breaks in humid days in August more frequent in the 1970s.
* Breaks in humid days in early September more frequent in 1970s and 1980s
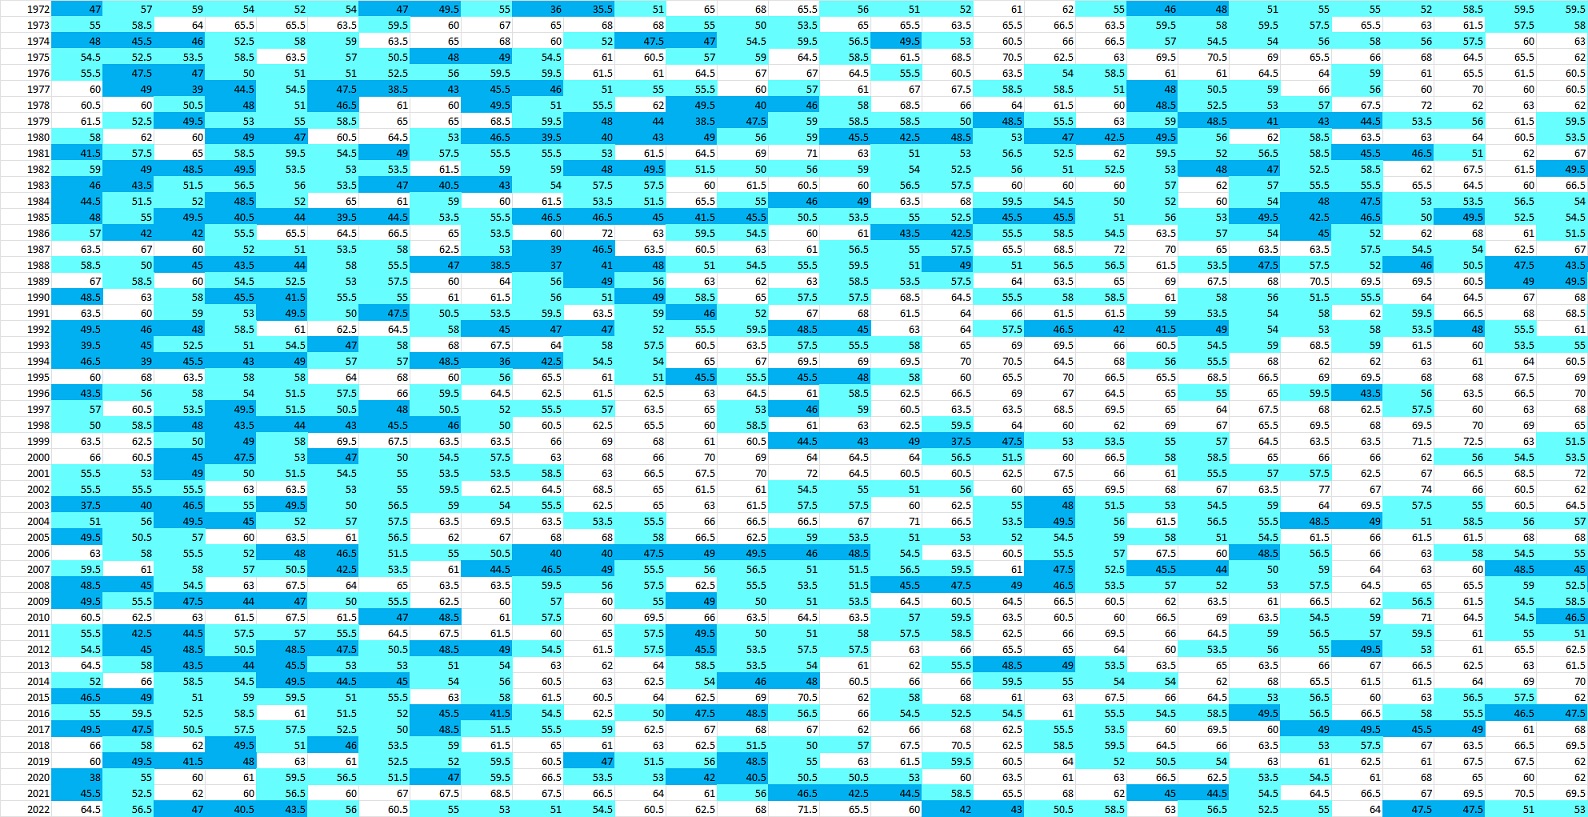
JUNE DEWPOINTS SINCE 1972 (UNDER 60)


JULY DEWPOINTS SINCE 1972 (UNDER 60)


AUGUST DEWPOINTS SINCE 1972 (UNDER 60)


SEPTEMBER DEWPOINTS SINCE 1972 (UNDER 60)

Monday, June 06, 2022

How Humid was Last Summer? A Look At This Summer


Last August I wrote about the summer humidity at that point in the summer (You can read about it HERE). So I figured I'd revisit the topic now with last summer's final ranking.

It turns out that SUMMER 2021 was the 4th most humid summer since 1948 followed by 2010 at #3, 2018 at #2.  What summer is #1?  1995


Was last summer (2021) ranked #4 because we had an abnormally high number of days with dewpoints in the 70s?  Probably not. The next graphic shows the number of hours for each year we reached a dewpoint of 70+.  

There were 21 other years with more than 2021!  So what was special about the humidity last summer?  It was consistently humid with very little breaks.  

The number of hours with a dewpoint BELOW a dewpoint of 60 really tells the story.  Only 5 years had fewer hours with dewpoints under 60!  1973, 1987, 1995, 2010 & 2018.   Basically last summer we had far fewer breaks.


Our summer outlook for 2022 highlighted a slow start to summer.  So far as of this writing (June 6) the number of hours with dewpoints above 70 is ZERO!  


Last summer at the end of June we had 71 total hours so we have a long way to go to catch up to last year.  Remember it's early


Tuesday, July 23, 2019

Northern Ohio Heat Index History

After the recent extreme heat and humidity across the country where more than 85% of the 48 contiguous state had temperatures above 90 degrees with heat indices above 100 across 30 states, many have asked how this heat wave has compared to past heat waves here in northern Ohio.


HIGHEST Heat Index levels for every hour in Cleveland since 1948 (Hopkins Airport)


Highest Dew Point for each hour - Cleveland (Hopkins Airport)


For comparison, the LOWEST wind chill (feels like temperature) for each hour since 1948


What are the longest stretches with a heat index of 100+?


How about the years with the most hours with heat indices of 100+ since the late 1980s?

This summer refers to 2019

All of the 100+ heat index stretches greater than 4 hours each year since 1950


What is the all-time heat index record?

178 degrees!

Air temp: 108, dew point: 95 in Dhahran, Saudi Arabia, July 8, 2003