Showing posts with label MJO. Show all posts

Monday, April 17, 2023

What's Driving The Big Temperature Changes?

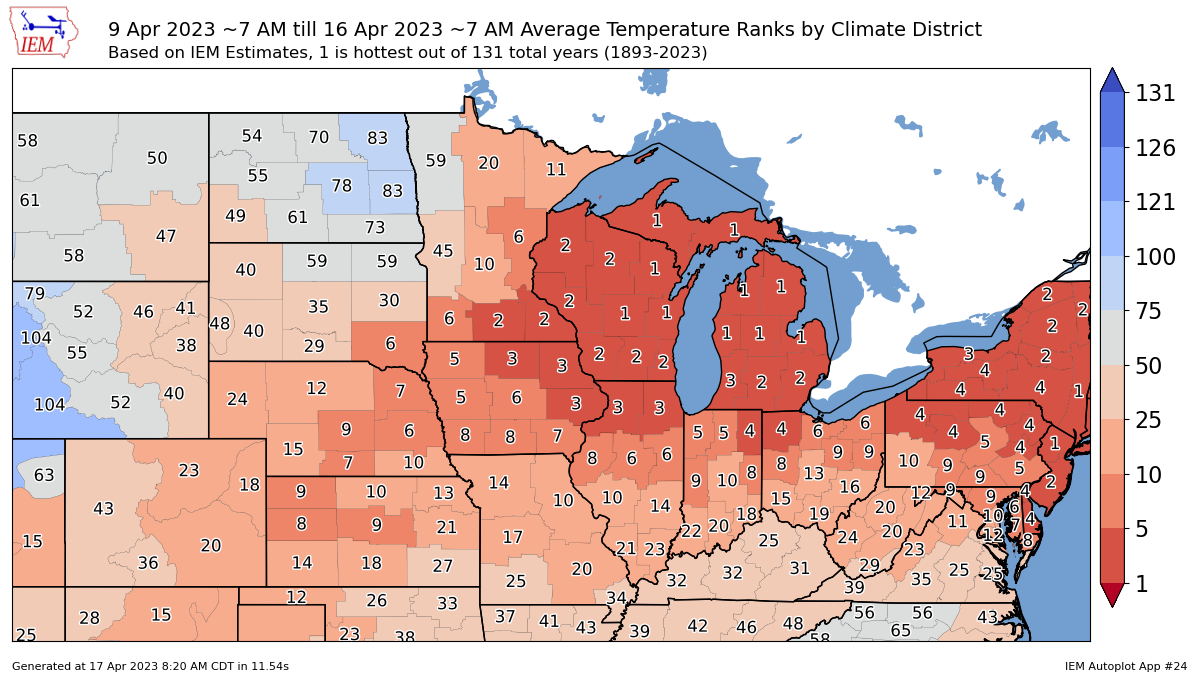
We just came off of the warmest seven day period since the middle of last September. 

64, 74, 80, 82, 82, 80, 79

Winning lotto numbers...not bad considering is occurred between April 10 and the 17th.  Look at these temperature ranking during the period. 


We came off of a highly variable March. No long stretches of warmth. A nine day stretch with below normal temps in the middle of the month. 


Why the pattern become consistently warmer?

The answer lies in the MJO (Madden Julian Oscillation). We need to look at the tropical Pacific. 

The MJO (read about it here) moves in varying magnitudes from west to east along the equator.  Here is a nice animation.  Green is more cloud cover. Brown colors are less cloud cover.  Notice how the northern Pacific jet stream fluctuates as the MJO moves through different phases (1 to 8).


Here is cross section of what is occurring.


How does something that is on the other side of the earth impact our weather?

Notice the temperatures in early March when the MJO was in a super-strong phase 8-1, slightly warmer than normal than it moved into a cooler phase (2 & 3) which connects with the cooler than normal mid March.  MJO then spun back around to phase 7-8-1 (lower magnitude) which connected to the 70s and 80s we had last week. The MJO impacts are different depending on the season.  You'll notice the MJO in similar phases (April 17 to 30 forecast but weaker) to early the March phase (stronger).  This looks to connect with a cooler next 7-10 days across the eastern 2/3 of the US.


There are always many drivers at work impacting the weather pattern. The MJO was just one of many influencing our weather with summer like temperatures last week.


Monday, May 17, 2021

What Drove the COLD End of April/Early May?

Seven Hills, April 20, 2021

The first 2 days of April featured snow and cold. We forget about how warm April the second full week of April was (highs in the 70s and 80s). 


Here's what most of us said on April 10th: "Winter is over. Spring is here!"

Then the bottom fell out.

Late April/early May cold was significant across the northern half of the US.  Slushy snow fell (which melted off fast) on May 9 along with 2-4" of rain Mother's Day.  Temperatures for most days were running well degrees below normal from April 15th through last week. 


So what happened?

The MJO (Madden Julian Oscillation) headed into a high amplitude phase 7,8,1


This connects well to colder than normal temperatures across the eastern US.

You can see how the surface temperatures & 500mb (upper level pressure pattern) vs normal evolved over the period. I circled the Greenland High Pressure/Block. This was responsible for locking in the pattern set up by the MJO.

April 24-30 temperatures vs normal

Upper Level Pressure Pattern vs normal

May 1-9 temperatures vs normal

Upper Level Pattern vs Normal

May 10-14 Temperatures vs Normal

Upper Level Pattern vs Normal

Notice how the Greenland Block started to weaken last week. As it weakened the cooler pattern started to break down.

Here's what the general public was say on May 9-10th: "What is going on here? Snow in May. Seriously? I can't remember the last time this happened this late."

In reality, we had a COLDER early May last year (2020) with even later snowfall.


In late April we started to see signs of warmth the last 2 weeks of May.


The pressure pattern still strongly suggests the Bermuda High to pulsate north through the end of the Month/early June as the MJO amplitude goes down/heads into phase 3,4,5,6.


Temperatures from May 17 through May 27


This WARMER pattern is a harbinger of what is to come this summer!

I can hear the cries of viewers saying "The weather is going from winter to summer again".  

(In reality this has happened many times before in weather history but I digress). Our spatial and recency bias is strong when it comes to weather.

Tuesday, February 21, 2017

Will Cold Air Return After the Late February Warmth?

The stubborn southeast ridge threw a wrench in our winter temperature and snow outlook for Cleveland and the Ohio Valley (more on that next week). We anticipated it to stay further east It has remained very strong throughout winter driving many panhandle low type storms along with temperatures recently to levels only reached a few times since record keeping began in 1871.


The stretch of warmth in Cleveland will more than likely end up being the warmest 11 day winter stretch ever!  This February stretch is similar to a warm February stretch back in 1976 and 2000. Notice the widespread nature of the warmth back in those years.

Looks similar to this stretch...

Yet California keeps getting pounded with heavy rain/snow as the very strong Pacific jet stream continues. Reanalysis of vector wind anomalies at 300 mB since December 1st (3 day running average). Pacific jet is through the roof strong. No sign of the ominous western ridge which was dominant over the last several winters.

The MJO strength increased significantly since early February to very high amplitudes into Phase 6,7 and 8 territory.


Phase 7 and phase 8 in February with high amplitudes tend to favor warmth east. Yet look at Phase 8. It tends to favor cooler temperatures east (middle chart below). So even with a very strong MJO the temperatures can be highly variable. What I find interesting is that the Phase 1 temperature composite (far right map below) looks very similar to the overall pattern since this current warm up began.
The chances of this February finishing out as the warmest ever in Cleveland is climbing fast.


Will colder air return?  If so, how strong?

To answer this we look at the Pacific teleconnections to start March. I reference my quick cheat sheet so that I can visualize the pressure regions in question.

PNA is heading sharply negative
EPO is heading positive/neutral
WPO is heading negative (strongly negative)


Strongly negative WPO during the first week of March
What do these teleconnection levels mean for our sensible weather?  Historic temperature composites for each of these indices (PNA,WPO,EPO) in March mean below normal temperatures across the northern states centered over the Corn Belt and High Plains. The Computer models are also depicting colder air (see graphic below, lower left) centered across the upper midwest/west to start March with above normal temperatures across the eastern US and deep south.

While we should anticipate short-lived cool intrusions across the Great Lakes, temperatures overall will average out near the 30 year average (see lower right graphic) for the first week of March.  For Cleveland, daytime average high temperatures for March are in the lower 40s. 


Long range teleconnections for the middle of March show some colder signs centered central US and west. Something to watch over the next week.


The South Oscillation Index (SOI)--changes in the pressure patterns in the tropical Pacific Ocean (click here for more on the SOI and here)--shows rising pressure in the central US March 10-13th after the central US trough slides east March 7-9th.


Will the weak trough be a more permanent feature over the Great Lakes or will a warmer ridge develop by the 3rd week of March?  The answer will be apparent in both the SOI changes. The teleconnections will reflect the changes by the end of next week.