Showing posts with label SOI. Show all posts

Friday, June 02, 2023

Little Humidity. Little Rainfall. The Complete May 2023 Recap


Lots of colorful  👇   charts here so be prepared!  

We were coming off of an extremely wet April. Temperatures were slightly above normal.  7 of the last 10 days had measurable rainfall.  Back in late April the changes in the tropical Pacific (SOI drop), northern Atlantic (negative NAO) and Bering Sea Low pressure were strongly pointing to a cooler than normal start to May.


Early May Outlook posted back on April 21

The upper level pattern in 7 day increments:  500mB (18,000 feet on left)  Jet stream on the right featured an active west-to-east storm track left over from late April.

May 1 to May 7

By the second week of April, the ridge over central Canada shifts west and south.

May 8 to May 14

Notice the split flow which emerged in the middle of the month. Storm track along the southern border and west to east through central Canada and into New England.

May 15 to May 21

By the final week of May, two pronounced jet stream tracks kept storm systems away from the central keeping the mid-west and corn belt very dry.

Overall temperatures west of the Mississippi and in the upper mid-west were above normal.


The center of the heat was in western Canada.


The split flow kept a large portion of the central US, deep south and Great Lakes extremely dry.


In northern Ohio, we had rain to start the month which skewed the overall totals. 25 of the 31 days were dry.


Temperatures in northern Ohio were slightly below average.  We had more days below than above.  Days in grey were a degree to either side of average.


By far the biggest element was the lack of humidity.  


In fact, April had more humid periods than May. 


We average more than 105 total hours of high humidity in May.  We ONLY had ONE HOUR!  Only 1966, 67, 68 and 1971 compare.


April and May high humidity periods (total hours) compared to past years.


The average northern Ohio humidity in May was the 3rd lowest since the last 1940s.


Severe storm warnings were non-existent in Ohio and surrounding states compared to April.


What about June?  On May 22nd, the tropical Pacific indicated a HUGE drop in the SOI.  Using the historical analogs, the "less humid & dry" pattern looks to continue through the middle of the month.  The projections on June 2 were latching onto this idea bigtime.


What we will watch during the second half of June/early July is how much the severe dry conditions will persist.  If they do, the dry ground could feed the central US ridge further enhancing the heat. More on this in the weeks ahead.


Tuesday, December 07, 2021

December Warmth is Coming. So When Did We Know?


For several years, I've been implementing a variety of research in creating long range outlooks for the Ohio Valley and Great Lakes on the 18-21 days time scale. In fact last year, almost a year to the day, I issued a long range December outlook using the same techniques highlighting a panhandle snow track on the 8th  (Outlook was dead on. The percentage was too low)   CLICK HERE FOR THE POST 

One of the variables I use is daily changes in the Southern Oscillation Index (SOI).

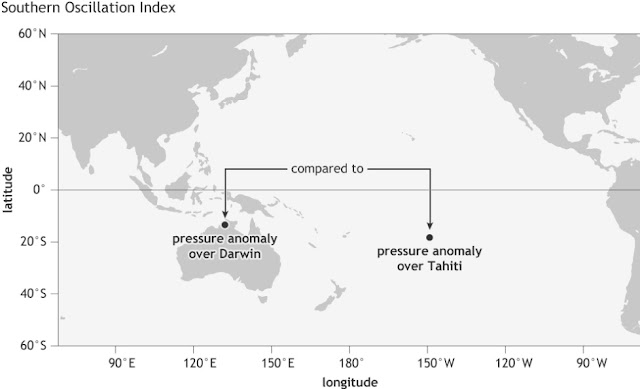
The SOI is the different in pressure between Darwin, Australia and Tahiti.

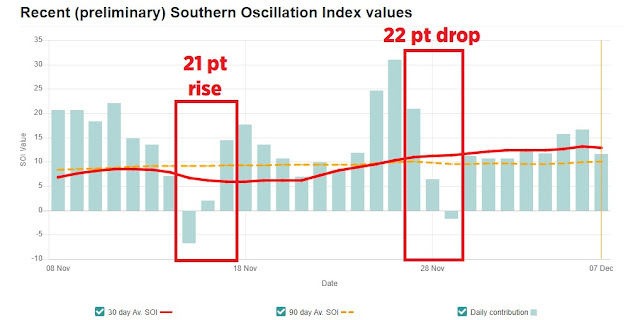
Look at the daily SOI values since early November.  Notice the period where the SOI rose near 20 points over a 2 day period and a drop of more than 20 points. First period was Nov 15-17, the second was Nov 14-16.


The sharper the change (rise or drop) the greater the effects in other parts of the world. Meteorologist Joe Renken was instrumental in doing the research showing what these changes mean 2-3 weeks days in the future across North America in different seasons and different ENSO states (El Nino, Nada or La Nina).  You can read the paper HERE. 

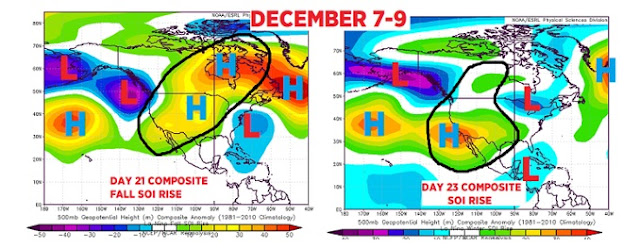
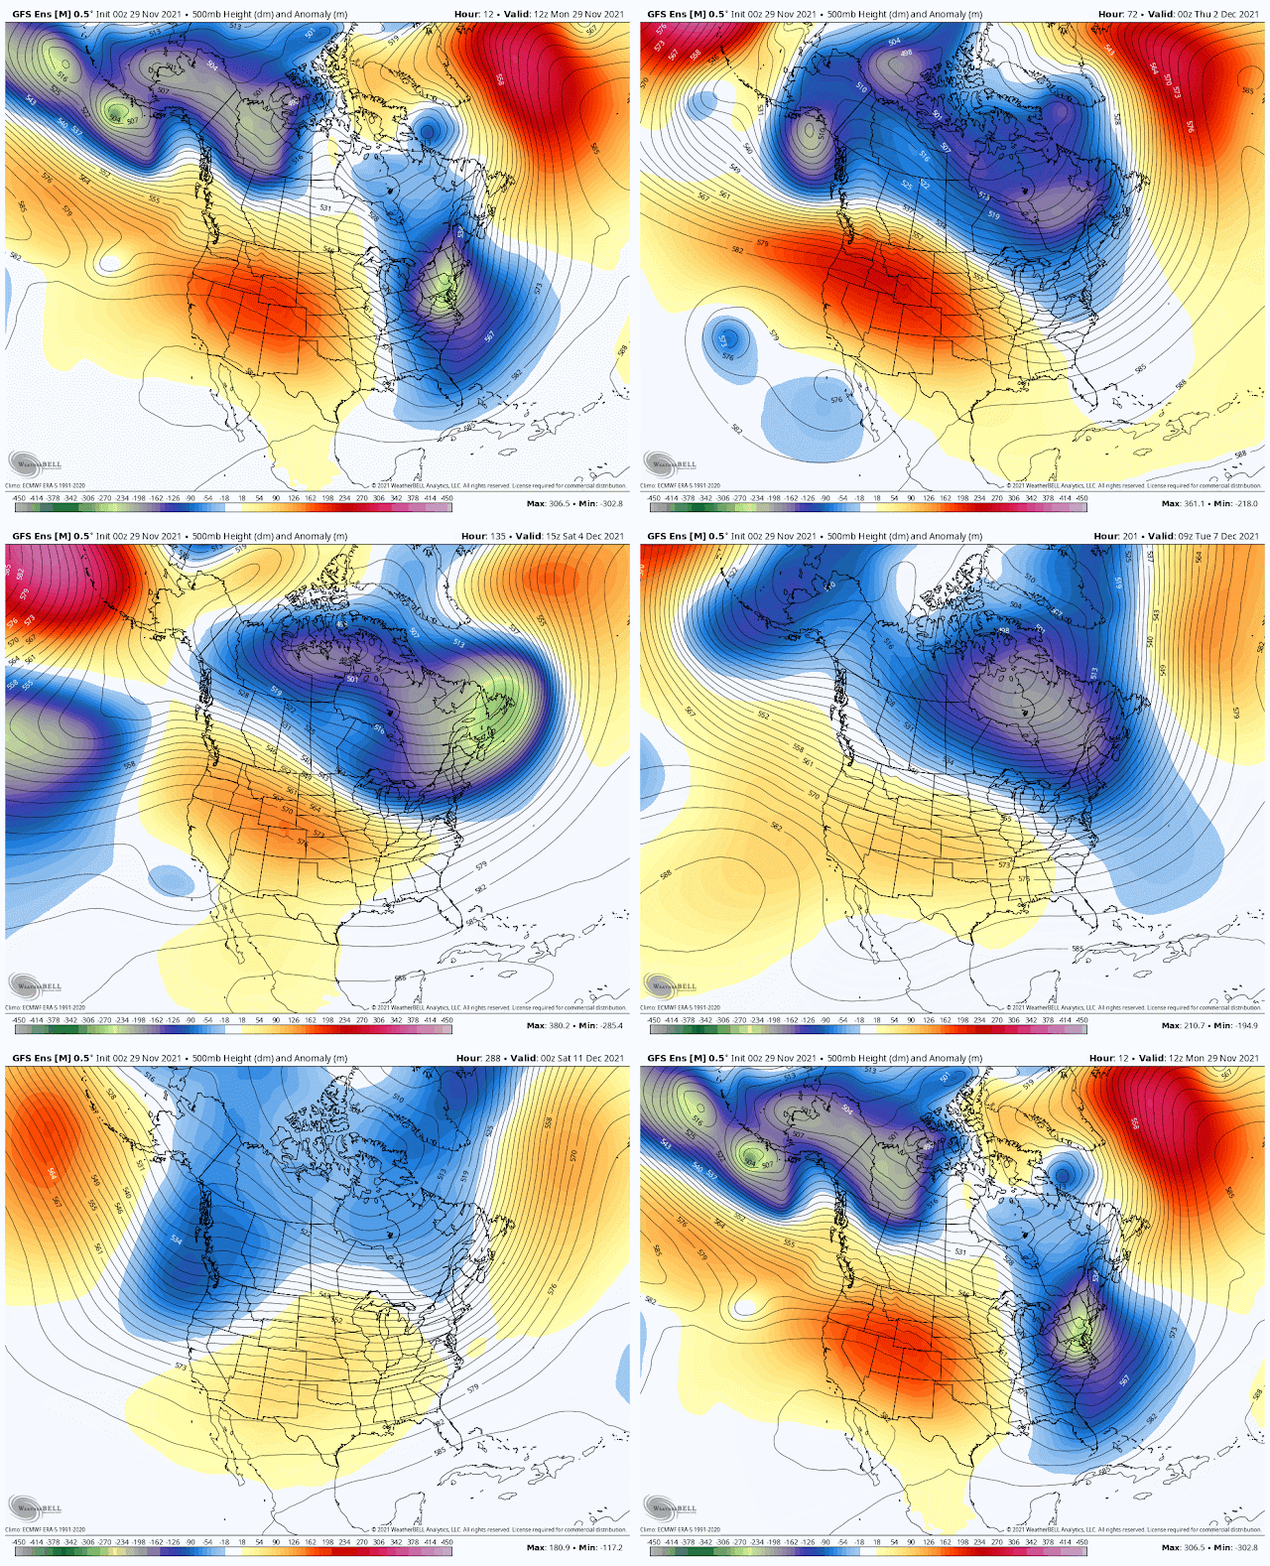
The first sharp SOI rises above yielded these upper level composites in similar seasons/conditions. Notice the ridge in the central US and the lingering Great Lakes/Eastern US low pressure.  I posted this a week before Thanksgiving. The seeds were for the December warmth were planted here.

SOI composite: Day 21 & 23 ahead

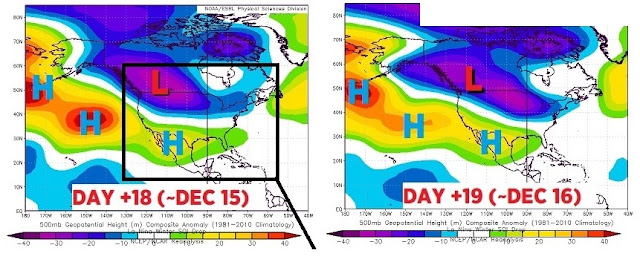
The SOI drop (right red box above) gave us these composites.


You can see the high pressure/warmth across the southern states.  What's also apparent is the lingering low pressure from the British Columbia coast east along the US/Canadian border and into the Great Lakes. A big indicator that Clipper Systems and short-lived intrusions of cold will interrupt the warmth. We have already seen this up & down pattern in reality thus far since Thanksgiving.  Remember that this pattern was indicated in late November.

The actual computer model output (GFS) on November 29 mirrored the composites!


So what did all of this SOI analysis before Thanksgiving tell us about the mid-December outlook?  It tells us that above normal temperatures were coming. We'd have brief interruptions of cold with local snow from time to time before the longer lasting period of "warmth" around the middle of the month. As of this writing (December 7) I still think we will see a 60 with sun BEFORE Christmas week!

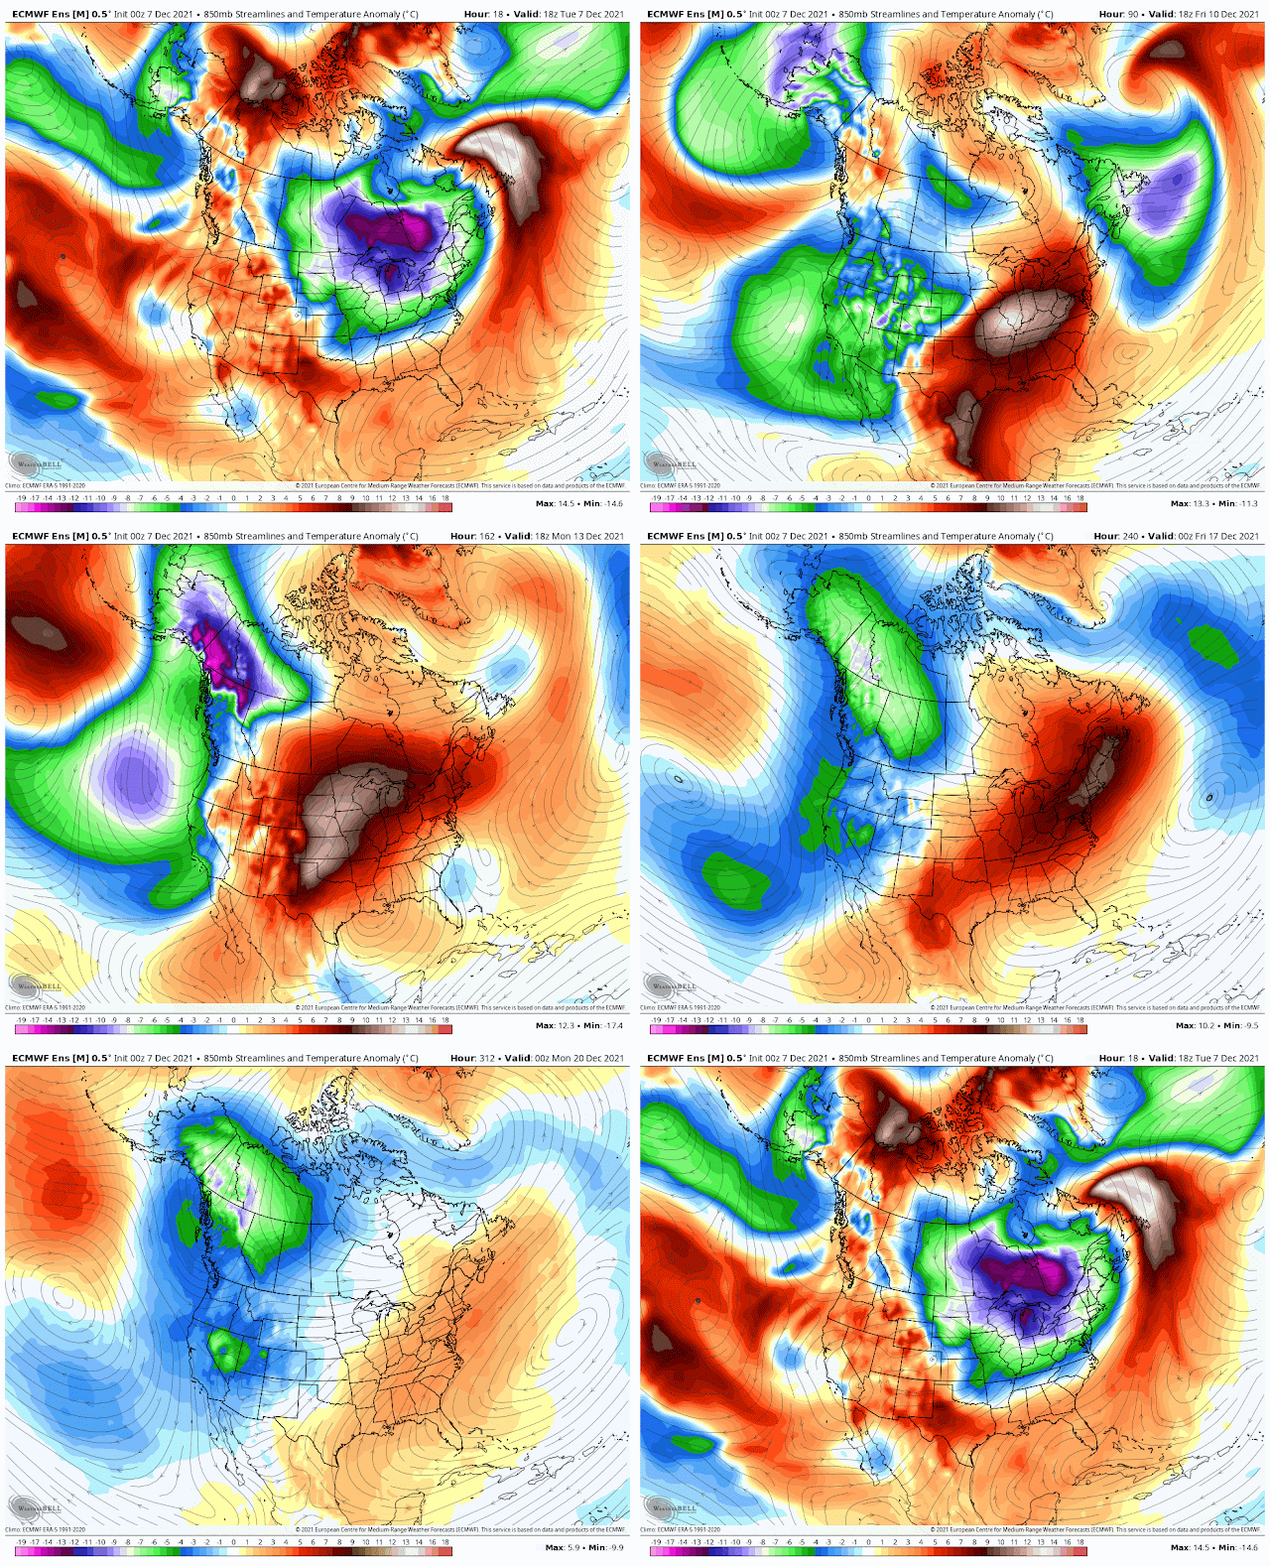
The current model output (December 7th) shows the warmth finally popping across the eastern US. Loop is from Dec 7 to December 22.  

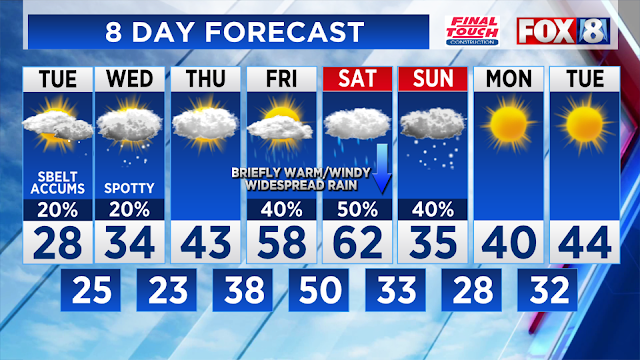
Our northern Ohio 8 day forecast illustrates the up and downs.


Note that the SOI was only one of several other variables (not mentioned here) were used in creating the mid December outlook. 

Who says we can't predict the weather 20 days in advance!

Any questions send me an email:  scott.sabol@fox8.com

Monday, April 26, 2021

Second Heaviest Snow This Late In The Season. When/How Did We Know?

I'm 5 days late with the late April snow recap.  Here are the snow amounts:  A few locations were close to 8 inches by Thursday morning.

April 21 snowfall

Euclid


Seven Hills

Perry

Snow after March 20 is pretty common in northern Ohio.  Snow after April 20 is a rarity. Only two other years have had more than 2" after April 20.  1974 and 2005. The 2005 event was over a 48 hour period (see the map below).


April 23-25, 2005 snowfall.  Remember this? More than a foot of snow fell across a large part of northern Ohio.  In 3 days it was completely gone!


Signs were pointing to snow or at least a deep storm system with colder air back on April 5--two week prior.


The MJO was heading into favorable cold phases.


A recurving typhoon near the Philippines (which often times portends cooler than normal temperatures eastern US) gave us another good indication.


Eventually the long range models (back on April 8) picked up on this colder idea.

Animation of temperatures: April 10 to 22


Upper level pattern was pretty close to April 2005 snow event. That storm system was deeper.


What's the latest we've had snow? After cross-referencing hourly temperature data, the years are narrowed down to only a few.  Last year was the LATEST MEASURABLE SNOWFALL which broke the record set back in 1907.  Flurries were reported close to Memorial Day in 1907 and 1961 (Akron).


How quickly after late season snow do we see an 80° degree day? Earlier in April it took us around 7 days (6 days listed below) post snow to reach 80°.  Snow on April 1.  83° April 8.


Indications of a late month warmup were surfacing shortly after the colder mid-month pattern was showing up.  SOI composites (analog to similar situations in a La Nina) showed a weak, short-lived ridge of high pressure/warmth around April 26th.

Composite for BIG drop in SOI around April 11-13/La Nina

High temperatures across more than 15 states Monday-Wednesday this week will easily teach 80


Tuesday, February 21, 2017

Will Cold Air Return After the Late February Warmth?

The stubborn southeast ridge threw a wrench in our winter temperature and snow outlook for Cleveland and the Ohio Valley (more on that next week). We anticipated it to stay further east It has remained very strong throughout winter driving many panhandle low type storms along with temperatures recently to levels only reached a few times since record keeping began in 1871.


The stretch of warmth in Cleveland will more than likely end up being the warmest 11 day winter stretch ever!  This February stretch is similar to a warm February stretch back in 1976 and 2000. Notice the widespread nature of the warmth back in those years.

Looks similar to this stretch...

Yet California keeps getting pounded with heavy rain/snow as the very strong Pacific jet stream continues. Reanalysis of vector wind anomalies at 300 mB since December 1st (3 day running average). Pacific jet is through the roof strong. No sign of the ominous western ridge which was dominant over the last several winters.

The MJO strength increased significantly since early February to very high amplitudes into Phase 6,7 and 8 territory.


Phase 7 and phase 8 in February with high amplitudes tend to favor warmth east. Yet look at Phase 8. It tends to favor cooler temperatures east (middle chart below). So even with a very strong MJO the temperatures can be highly variable. What I find interesting is that the Phase 1 temperature composite (far right map below) looks very similar to the overall pattern since this current warm up began.
The chances of this February finishing out as the warmest ever in Cleveland is climbing fast.


Will colder air return?  If so, how strong?

To answer this we look at the Pacific teleconnections to start March. I reference my quick cheat sheet so that I can visualize the pressure regions in question.

PNA is heading sharply negative
EPO is heading positive/neutral
WPO is heading negative (strongly negative)


Strongly negative WPO during the first week of March
What do these teleconnection levels mean for our sensible weather?  Historic temperature composites for each of these indices (PNA,WPO,EPO) in March mean below normal temperatures across the northern states centered over the Corn Belt and High Plains. The Computer models are also depicting colder air (see graphic below, lower left) centered across the upper midwest/west to start March with above normal temperatures across the eastern US and deep south.

While we should anticipate short-lived cool intrusions across the Great Lakes, temperatures overall will average out near the 30 year average (see lower right graphic) for the first week of March.  For Cleveland, daytime average high temperatures for March are in the lower 40s. 


Long range teleconnections for the middle of March show some colder signs centered central US and west. Something to watch over the next week.


The South Oscillation Index (SOI)--changes in the pressure patterns in the tropical Pacific Ocean (click here for more on the SOI and here)--shows rising pressure in the central US March 10-13th after the central US trough slides east March 7-9th.


Will the weak trough be a more permanent feature over the Great Lakes or will a warmer ridge develop by the 3rd week of March?  The answer will be apparent in both the SOI changes. The teleconnections will reflect the changes by the end of next week.