So far, December temperatures have been above normal not only across northern Ohio but across most of the US. Red colors indicate above normal temperature regions. Check out my previous POST which goes into why the pattern has been so mild/snowless.
Northeast Ohio weather and science blog covering severe storms, long term outlooks, climate, behavioral meteorology, technology and other observations
Friday, December 15, 2023
December 15 Forecast Update - A Look at December Thus Far
Thursday, December 14, 2023
Why The Milder December? A Detailed Look Into January
Just finished a detailed video of the primary drivers of the milder December and how these drivers will influence the pattern shift into January. Enjoy!
Tuesday, December 14, 2021
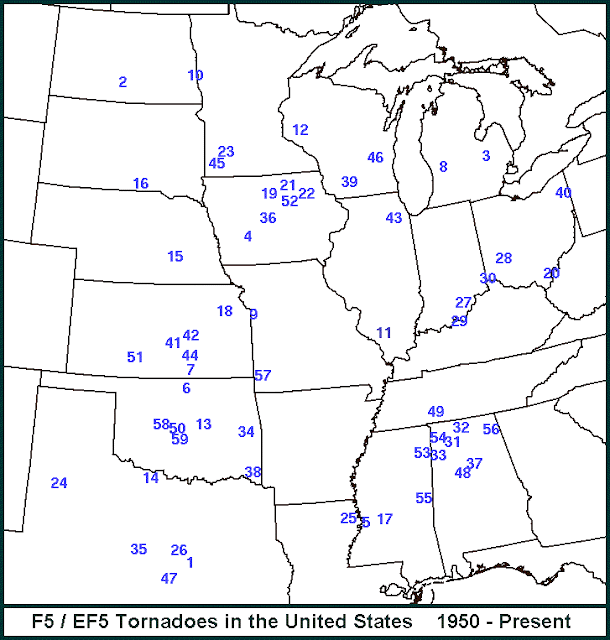
Deadly December Tornado Outbreak Recap
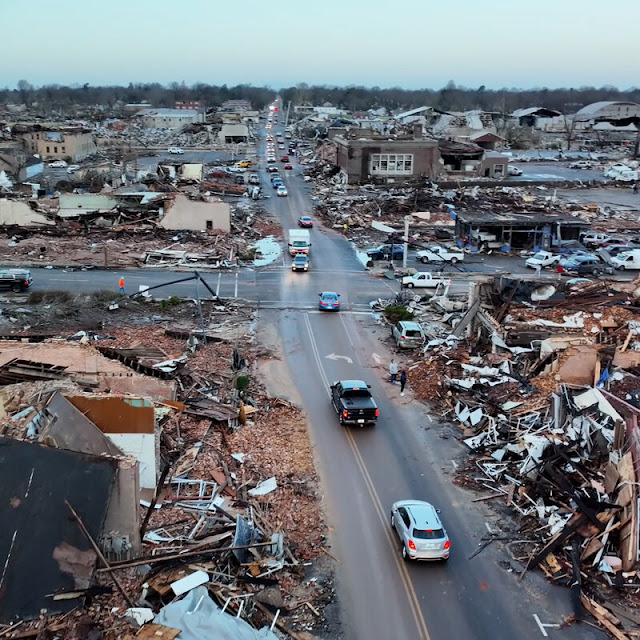
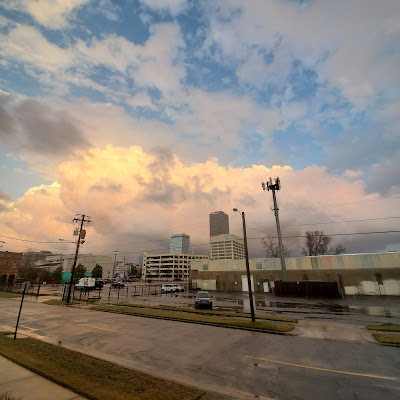
The clean up continues across the south after Saturday's deadly tornado outbreak.
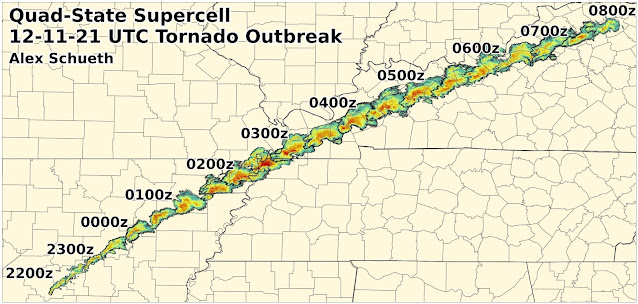
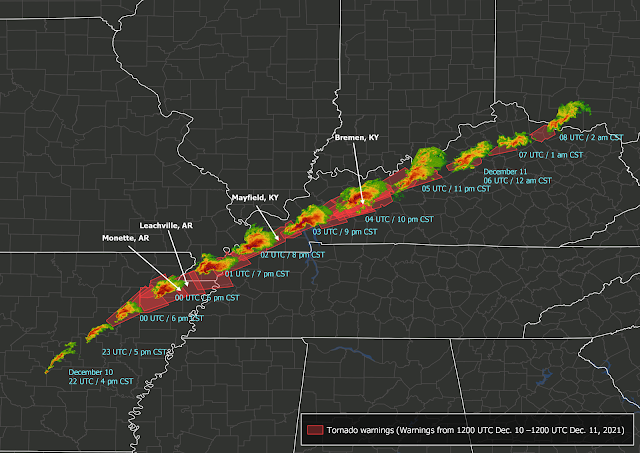
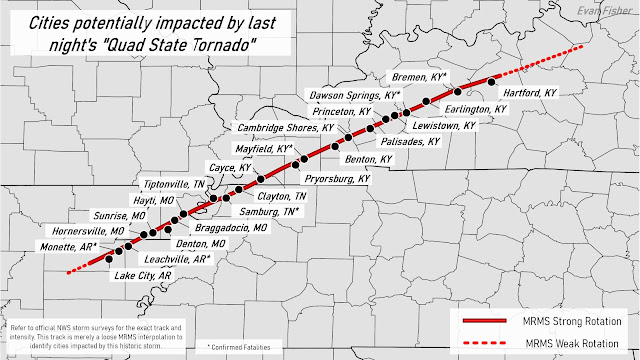
people lost their lives as 71 tornadoes hit after dark between December 10 and 11 across parts of 4 states. This LINK HERE lists multiple resources on the damage assessments.
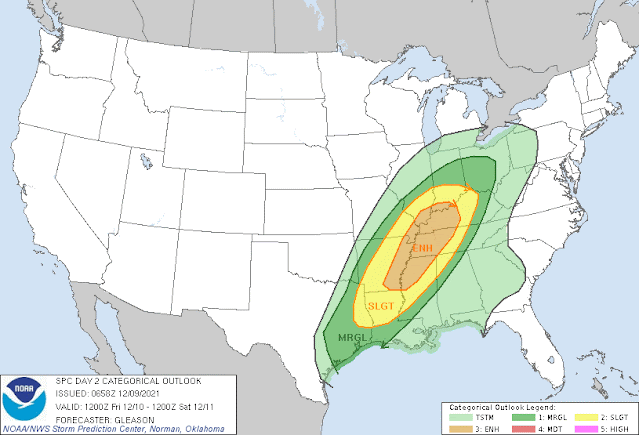
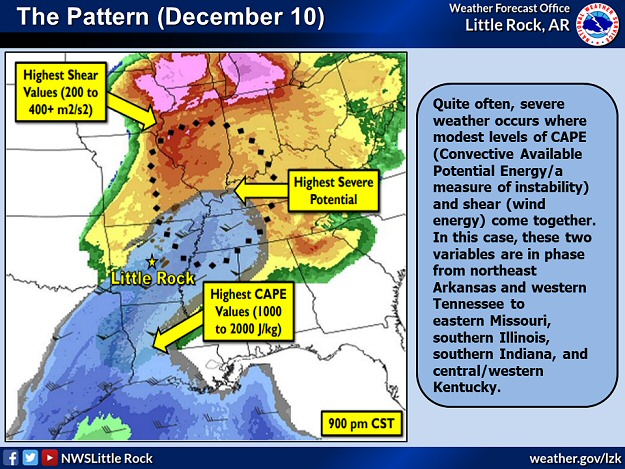
More than 48 hours prior to the event, the Storm Prediction Center started to plant the seeds of potential severe weather.
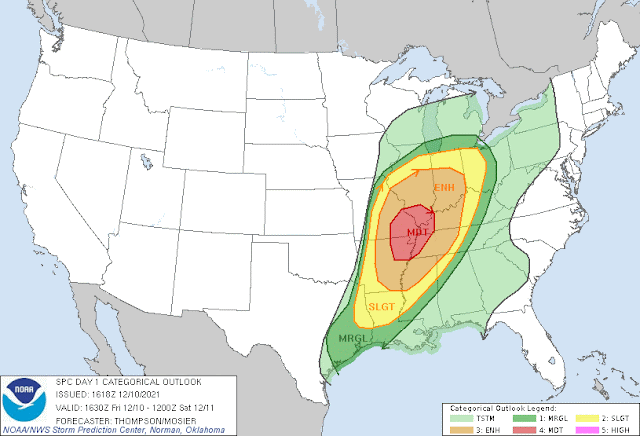
By Friday, the SPC narrowed and upgraded their outlook from Enhanced to Moderate:
| Nathan Scott, Little Rock, AR |
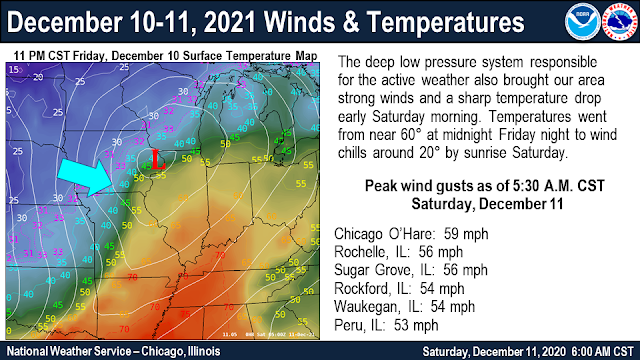
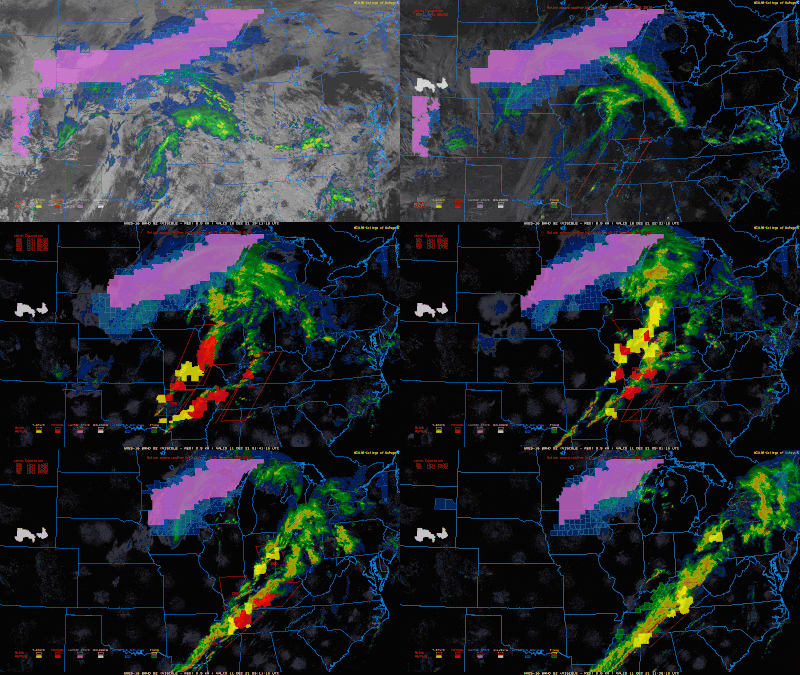
Look at the wide variation in weather occurring simultaneously on December 10-11. Winter weather watches across the upper midwest. Rapidly deteriorating conditions in the south as the line of severe storms tracked east. Notice the tornado watches/warnings in red.
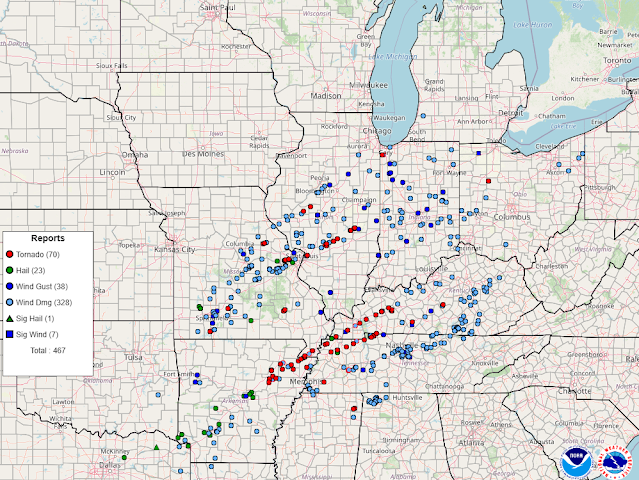
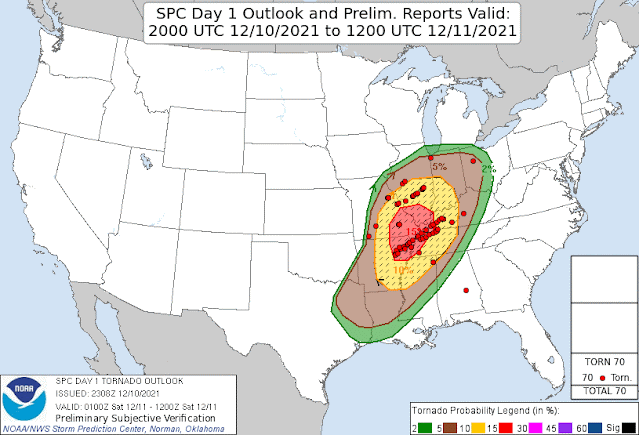
Meteorologists at the SPC and the various other NWS offices across the central US did an amazing job in giving advanced warning. Look at the accuracy of the outlook vs the tornado reports.
Thursday, December 08, 2016
Conditions Far Different This December vs December 2015
![]() |
| Hat tip: Peter Mullinax |
Pressure pattern completely the opposite of the polar conditions in early December last year where heights were much lower. Polar vortex was very stable probably influenced by the El Nino.
Temperatures last December were well above normal across the eastern 2/3 of the US
In fact, over the last 6 Decembers, only 2013 and 2010 were below normal east and/or north.
So far, temperatures in early December through the 5th were above average.
Based on the high latitude conditions at 10 mb (65 and 70,000 feet) mentioned above and the higher than normal Eurasian snow cover which has driven skyrocketing high pressure across Russia, this first shot of colder air across North America was not a surprise.
![]() |
| Nearly Record Setting High Pressure Across Asia in late November |
![]() |
| Graphic courtesy Greg Carbin, SPC |
Wednesday, December 09, 2015
Warmth Continues...When Will It Flip To Winter?
It can't last forever. So when will it flip or at least trend colder with higher chances of snow!
Remember our preliminary December outlook issued back in early September showed the core of the high pressure/warmth across the northern states into Canada with the core of the low pressure centers across the south (panhandle low type systems).
Through the first week or so, the core of each HIGH and LOW is much stronger than anticipated yet they are roughly in the same position as our forecast 3 months ago indicated. However, the southern lows (Panhandle type) are far weaker and, as of this writing--December 8th--are just now showing signs of developing. (see the smaller "Ls").
Since November, the warmth has been extensive with below normal temperatures in the west. Warmer colors indicate above normal temperatures, cooler colors below normal temperatures.
Some computer model projections have been bullish in tracking these southern lows further east and the warm ridge further north into Canada by the beginning of Christmas week.
The big questions for the end of the month and Christmas week: 1) How fast will the ridge lift north and 2) how strong will the low in the southwest/panhandle region push east?
We do know this: Any easterly migration of the southwest low along the southern jet stream will increase our chances of a wet panhandle-type snow by month's end.
The chances we will receive wet snow from a panhandle low will climb further after the first of the year.
Tuesday, December 09, 2014
Don't Be Fooled. Lots of Winter Left!
Winter arrived very early this year across much of the US. Per NOAA, the average contiguous U.S. temperature was 39.3°F, which is 2.4°F below the 20th century average. This ranked as the 16th coldest November in the 1895-2014 record, and was the coldest November since 2000.
US snowcover for the month was the most since 1966, a 48% increase from last (2013) November's snowcover.
November temperatures in northern Ohio were the 8th coldest on record at 37.1 degrees with a stretch of 9 days below 40. November snowfall was the most since 1996. We are ahead of last year when we count days with at least ONE INCH of snow cover at 12 (only 9 as of Dec 9th last year).
Many people falsely believed that the arctic cold would continue into December. Look at the top 16 coldest Novembers (16th is this year) in the chart below. Then look at the Decembers that followed. The temperature ranks are no where as cold relative to normal. The Decembers that followed had an average temperature rank of....48th! Only 2 cracked the top ten coldest.
Here is a comparison of November vs December through the 9th. December temperatures are not as cold relative to normal. The coldest air has lifted back into central Canada.
So what does this mean looking into our winter future?
All of the factors that went into our winter weather outlook are still present and valid. Nothing has changed.
1) Central Based El Nino has developed or is developing depending on which index you use. This central based Pacific El Nino favors colder than normal temperatures across the eastern US. Note the warm pool along the equator and the smaller cool pools flanking it. The cool pools are indications of a Modoki along with warm pool extending along the west coast of North America.
Are their similar years to what we see above? Yes. Below is a blend of those similar years. The scale is a bit different but the warm and cool pools are in similar locations and intensities. They're not exact matches but they are close.
2) Warmer than average water off of the west coast along with the cool pool north of Hawaii strongly favor ridging in the western US, troughiness in the eastern US. The Pacific North American Index (or PNA Index) measures this tendency. In most Decembers where the PNA is more than +1, the temperatures across the eastern US are usually below normal.
The forecast continues to favor a POSITIVE PNA into mid December.
3) The wild cards are always how the Arctic and North Atlantic will behave. The Arctic Oscillation and North Atlantic Oscillations are indices that measure changes in the pressure patterns over each location. The AO is more of a player earlier in the winter, the NAO during the second half. If the indices are negative, the pressure patterns favor a more variable jet stream with a tendency for more cold air outbreaks.
4) The QBO (another wild card), read about it here, are stratospheric winds over the tropics which alternate direction easterly to westerly every 2 years. These easterly winds have been shown to disturb the Polar Vortex over the arctic making it more unstable. The propensity for cold outbreaks is higher across North America but not guaranteed. We monitor warming in the stratosphere over the arctic. Sudden warming can be a sign of a weakening of the jet stream and colder outbreaks. A good description of these warming events is on this site. Check out this site for more on Sudden Stratospheric Warming events and their potential effects on our winter weather.
Each one of these variables should not be overstated. One factor doesn't make-it or break-it. Our outlook is a blend of the combined influences that each one of these variables bring to the table. All told, our Winter Weather Outlook from early November still stands


.gif)