Tuesday, January 18, 2022

Winter Snowstorm Recap MLK Day 2022 - Chapter 1 of 3 (PICTURES)

I'm breaking the snowstorm recap into three posts. The first is filled with pictures of measurements and an overall snow totals map with the final snow amount list from the NWS. Second post goes into the meteorology behind the developing storm. The third post highlights the forecast evolution.  What we got right.  What we got wrong.  What we would have done differently.

The biggest overall snowfall for northern Ohio in probably 10 years! (we had some big snowstorms in the late 2000s).  Look at these numbers:


This was the first time we've had a snowfall where more than 50% of northern Ohio had more than a FOOT OF SNOW since either 2009 or 2008.


Monday, January 10, 2022

Wind Chill History: When Did We Last Experience BRUTALY COLD chills?


Because I like colorfully displayed data that tells a story, I tabulated the TOTAL HOURS where we experienced WIND CHILLS BELOW ZERO for each winter recently using the IOWA MESONET SITE.

The last winter with wind chills -6 to -10 was 2018-19
The last brutally cold winter of 2013-14 featured wind chills under -30

So far this winter (2021-22), none yet.
I included some of the cold winter of the late 1970s/early 1980s for comparison


Thursday, January 06, 2022

Lake Erie Ice Coverage Update: Any Chance for Significant Ice?

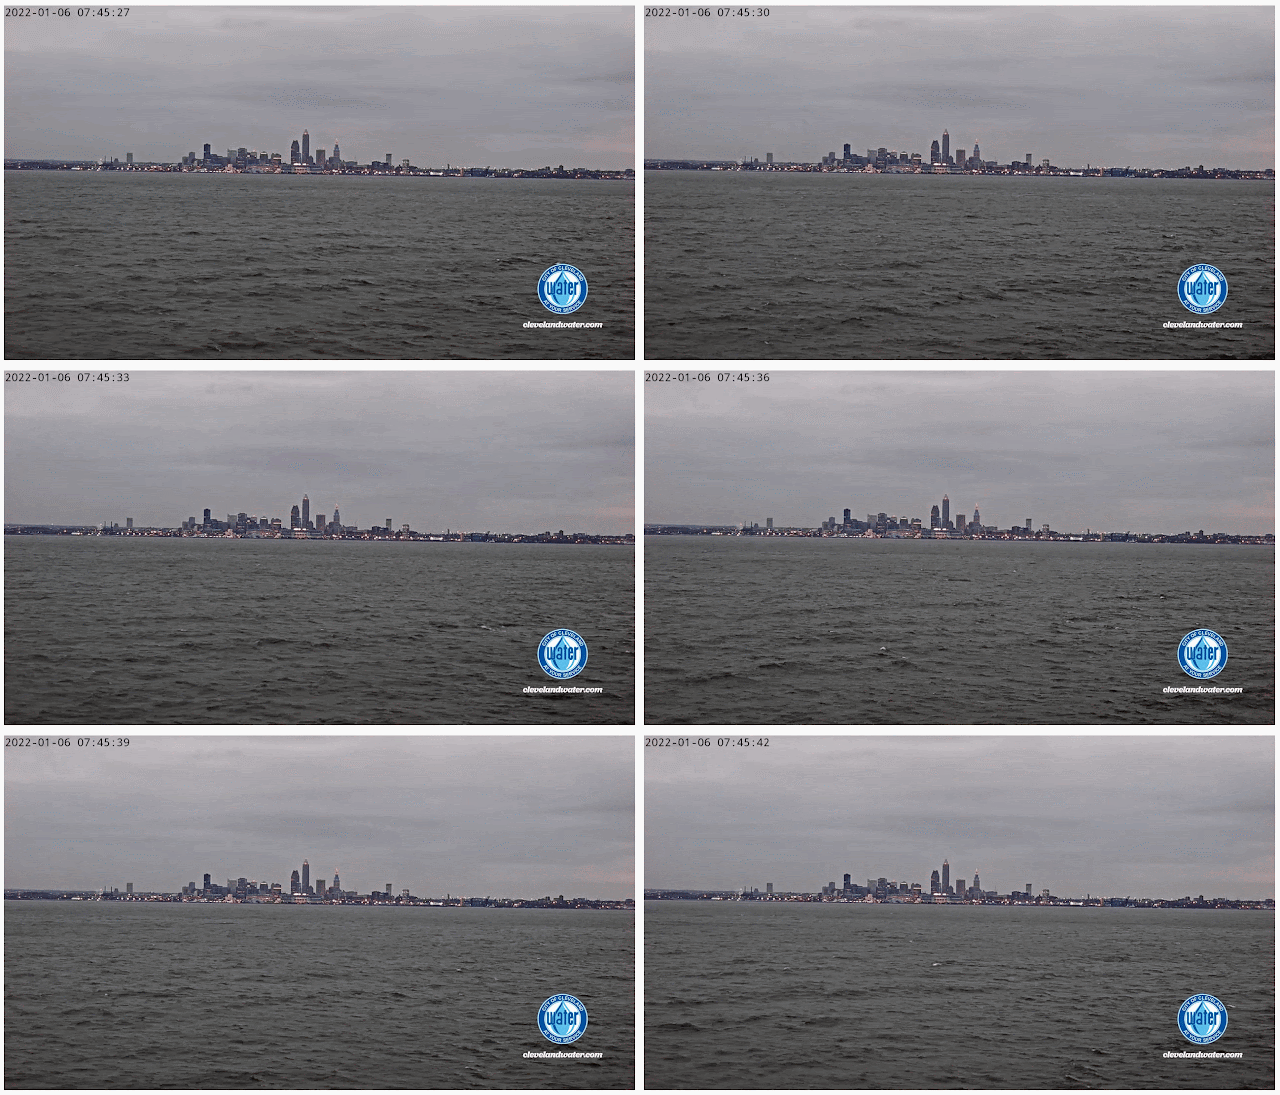
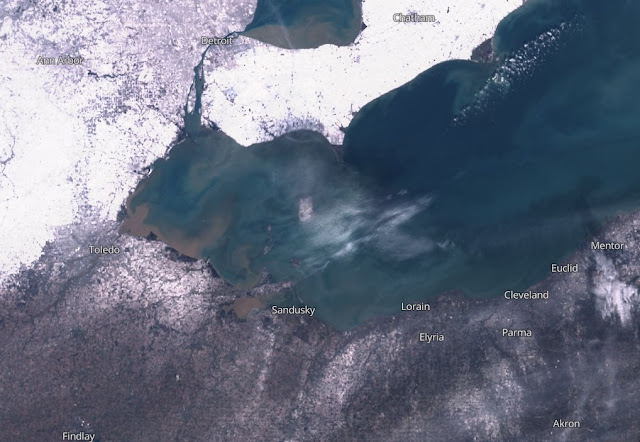
So far no ice has developed on Lake Erie this winter through January 6, 2022. 


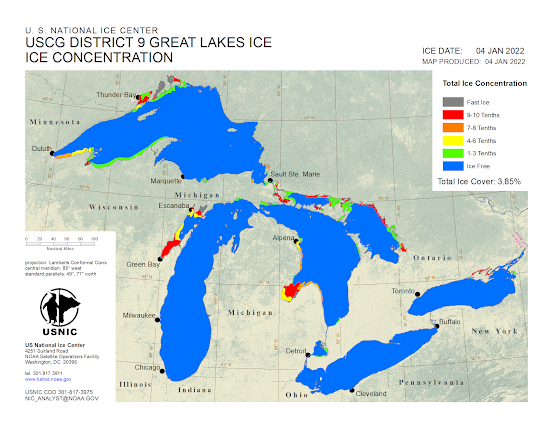
The Great Lakes as a whole is void of significant ice.

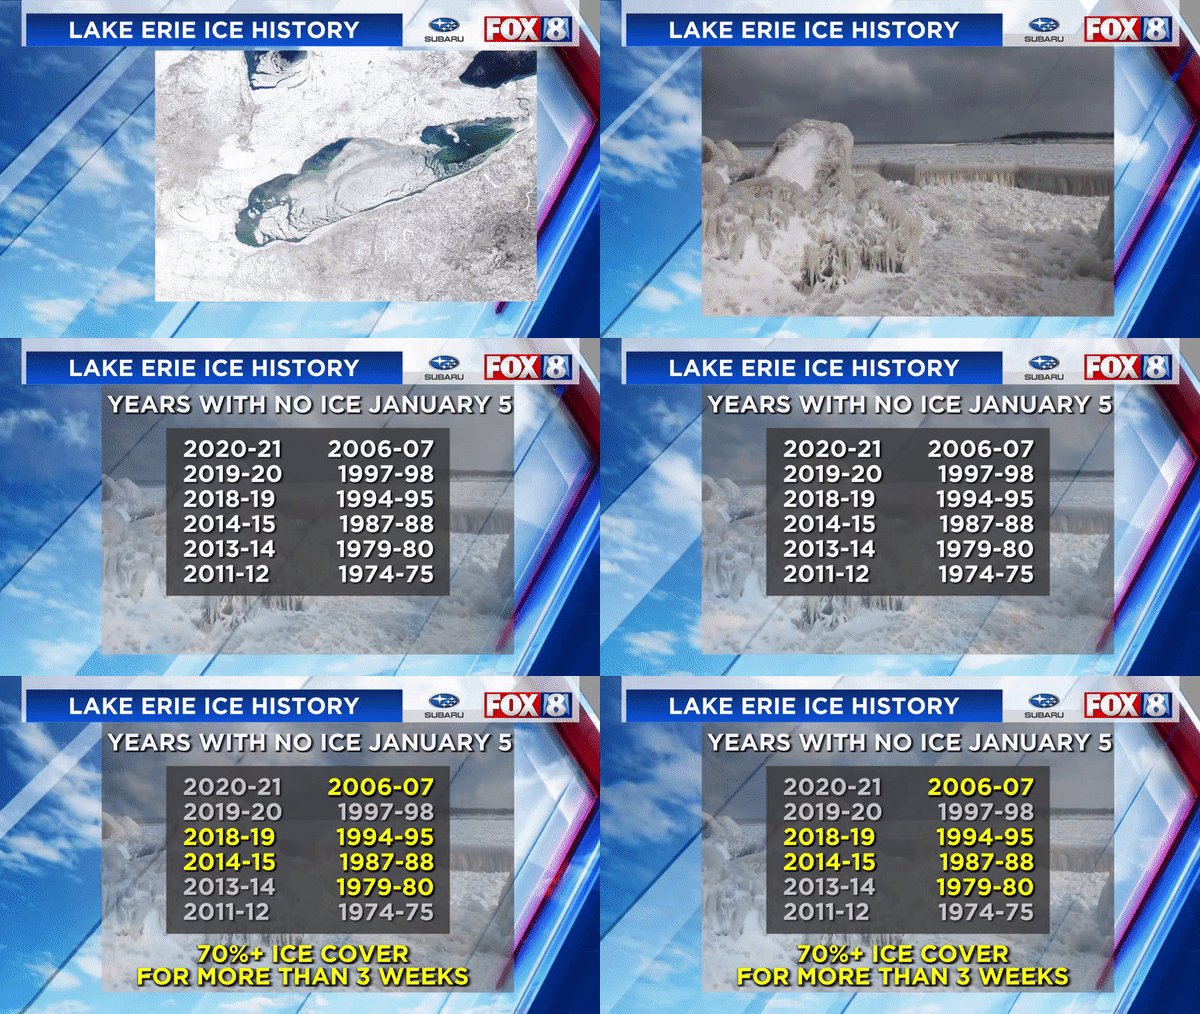
There have been 12 winters (since 1972 when records began) where no Lake Erie ice was reported through January 5. Over those 12 winters, 6 ended up with at least 70% ice coverage for at least 3 weeks later in the winter!


Lake ice development is directly influenced by the duration of cold temperatures.  The longer the temperatures stay cold, the faster and more expansive the ice coverage. 

Last winter I did some research on the years where ice coverage increased rapidly and the temperature conditions that were present for this to happen. 

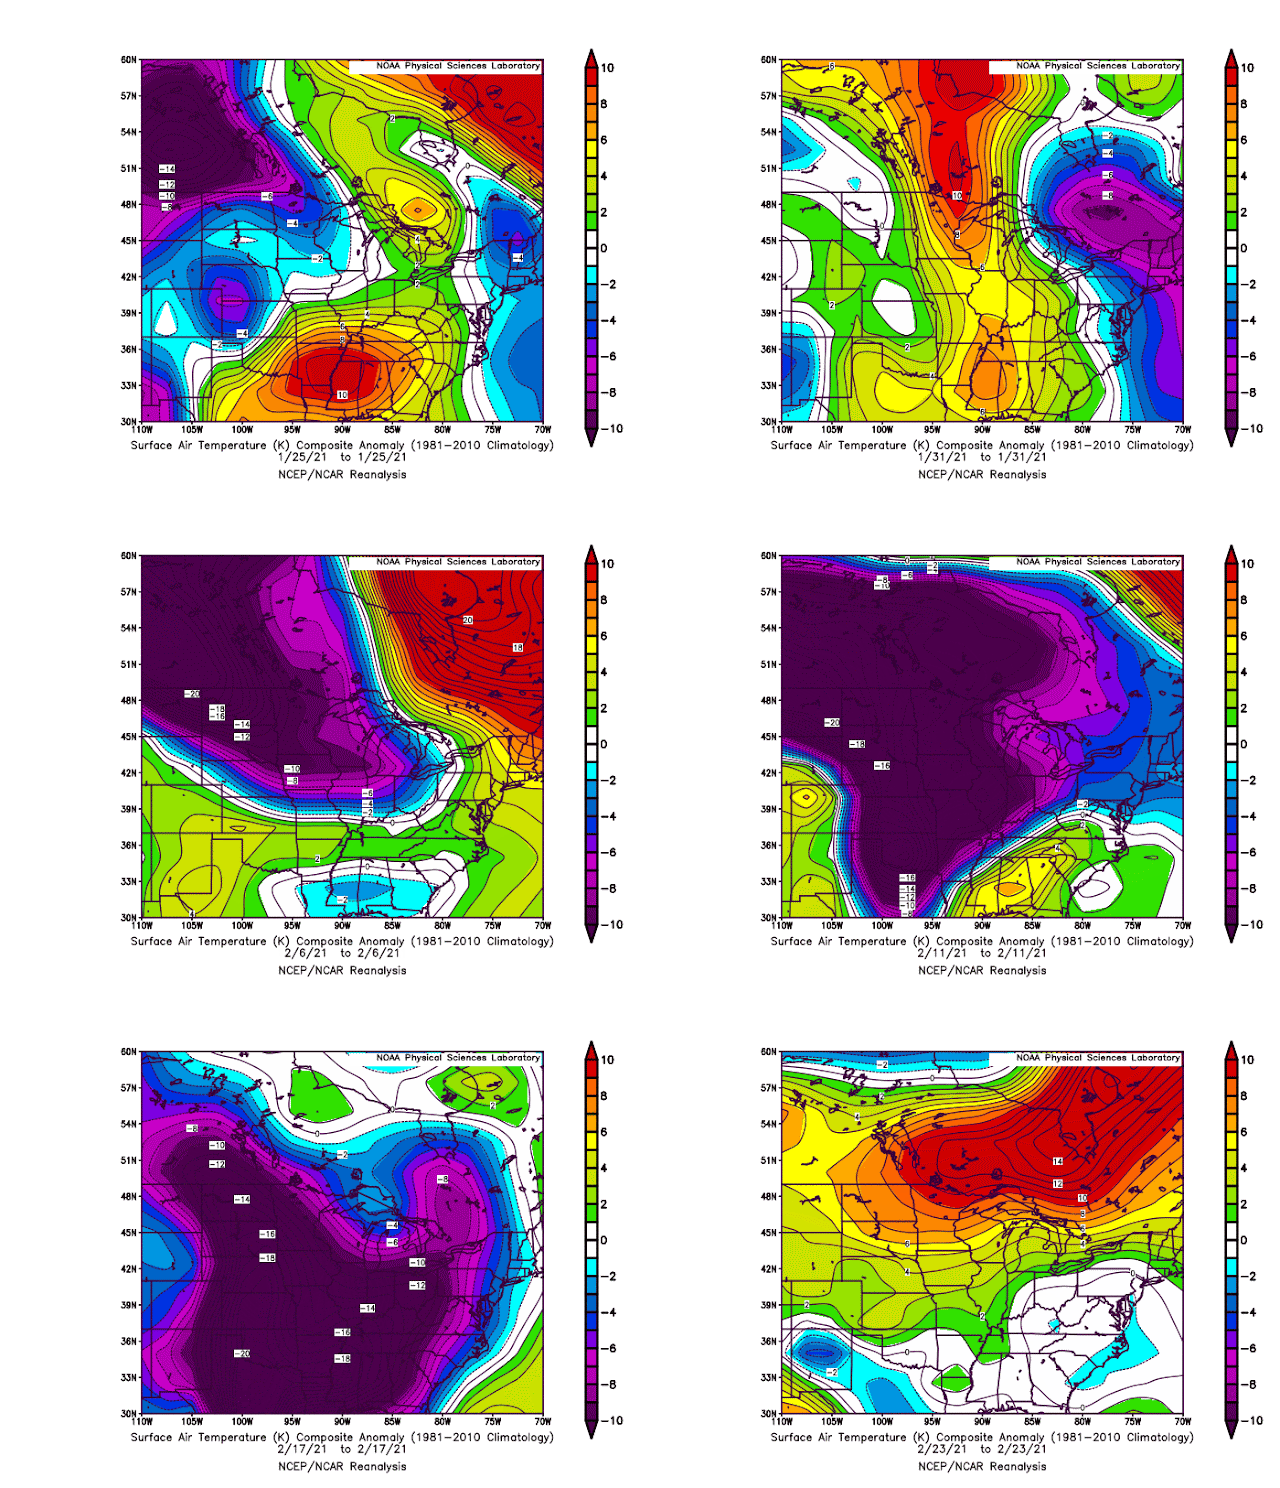
For example, in 2019 the average temperatures over the period of Lake Erie ice coverage expansion (roughly a 2 week period) was WELL BELOW NORMAL across a large portion of the Great Lakes.

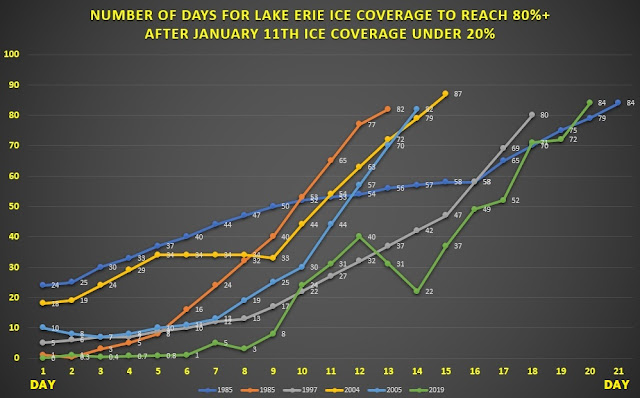
In similar years, the average amount of time of ice coverage expansion from 20% to 80% was roughly 2 weeks.


What are the shortest jumps from 20% to nearly 80% ice coverage?

2/7/1973 to 2/13/1973:    17% to 81% in 6 days
2/6/1995 to 2/11/1995:    16% to 80% in 5 days
1/17/1997 to 1/22/1997:  24% to 77% in 5 days
1/19/2005 to 1/24/2005:  24% to 82% in 5 days
2/4/2013 to 2/10/2013:    20% to 82% in 6 days
2/10/2016 to 2/15/2016:  0.7% to 79% in 5 days

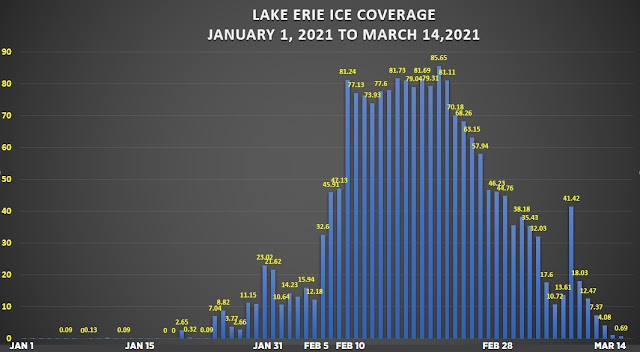
Last year, we had VIRTUALLY NO ICE through the end of January.  Then the early February cold developed and the ice coverage took off!


Look at the temperature vs normal from late January through mid February. It's no wonder the ice started forming this fast.
Temperatures vs normal: January 25 to February 23, 2021

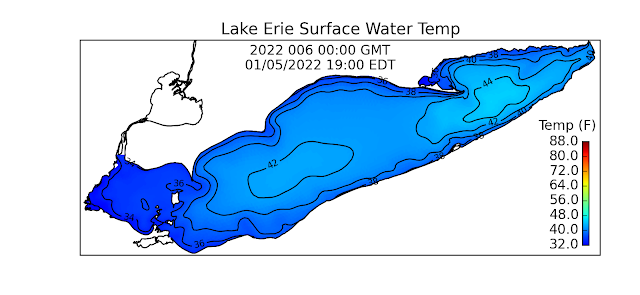
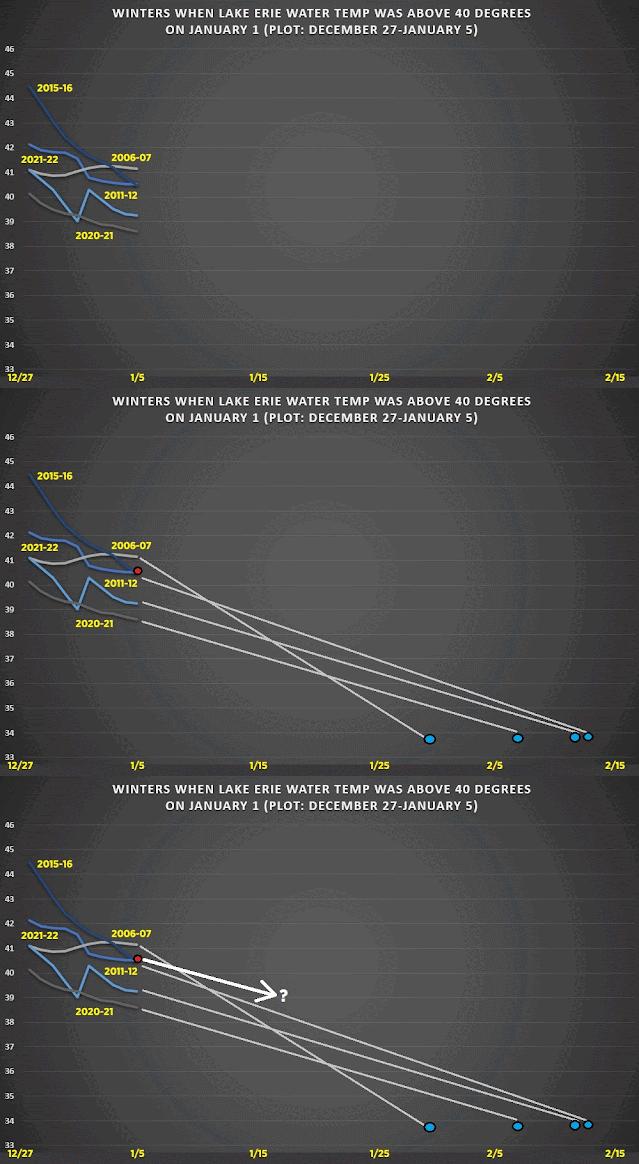
The issue this winter as in a few recent winters is the Lake Erie water temperature. The average water temperatures as of January 5 is still around 40 degrees. 


While there are local regions in the mid 30s (western basin) the water temperature overall is well above average.  When we compare this winter to other winters (2020-21, 2015-16, 2011-12 and 2006-07) when the water temperature was around 40 degrees on January 1st, it usually takes a month for the water temps to drop low enough to promote significant ice development.  How fast the current lake water temperature drops will be key this winter!


So what's the take home message from this research?   


* We still have some time to develop ice on Lake Erie

* Water temperature still needs to drop this month

* Ice coverage can significantly expand well into February

* Temperatures need to get significantly colder for at least 10 days (highs in the 20s) to develop significant ice (above 70%).

This has to occur between now and the first 2 week of February

* By mid March, lake ice begins to melt in most winters. Here is the weekly ice coverage for all winters from mid February to mid March:


Friday, December 24, 2021

Why Was December So Mild? A Look Into January

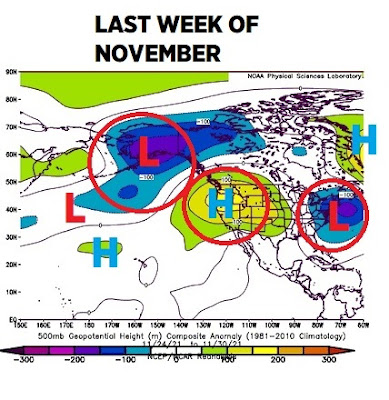
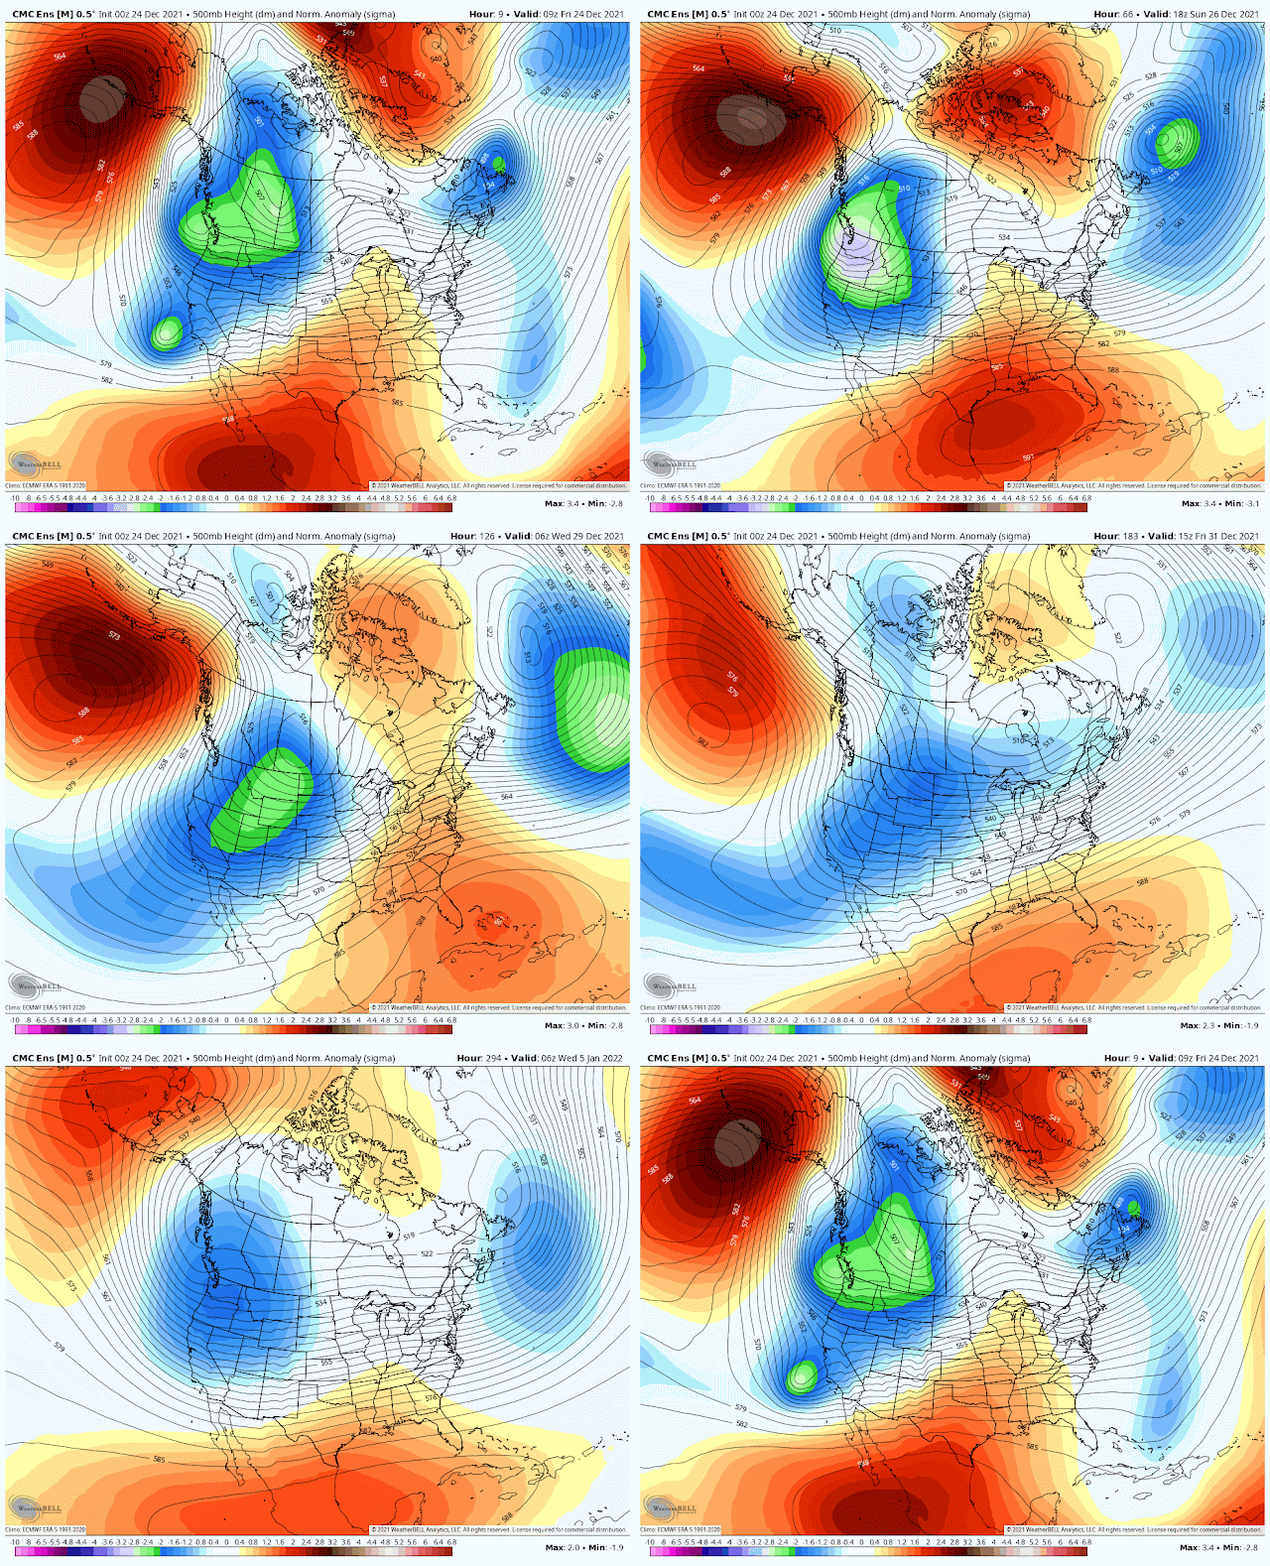
Check out the upper level pattern in November. The red areas are high pressure. Blue areas low pressure. Notice how progressive the storms systems were. Temperatures were colder than normal. No definitive regions of high pressure (blocks) locking in a long stretch of cold or warm. 
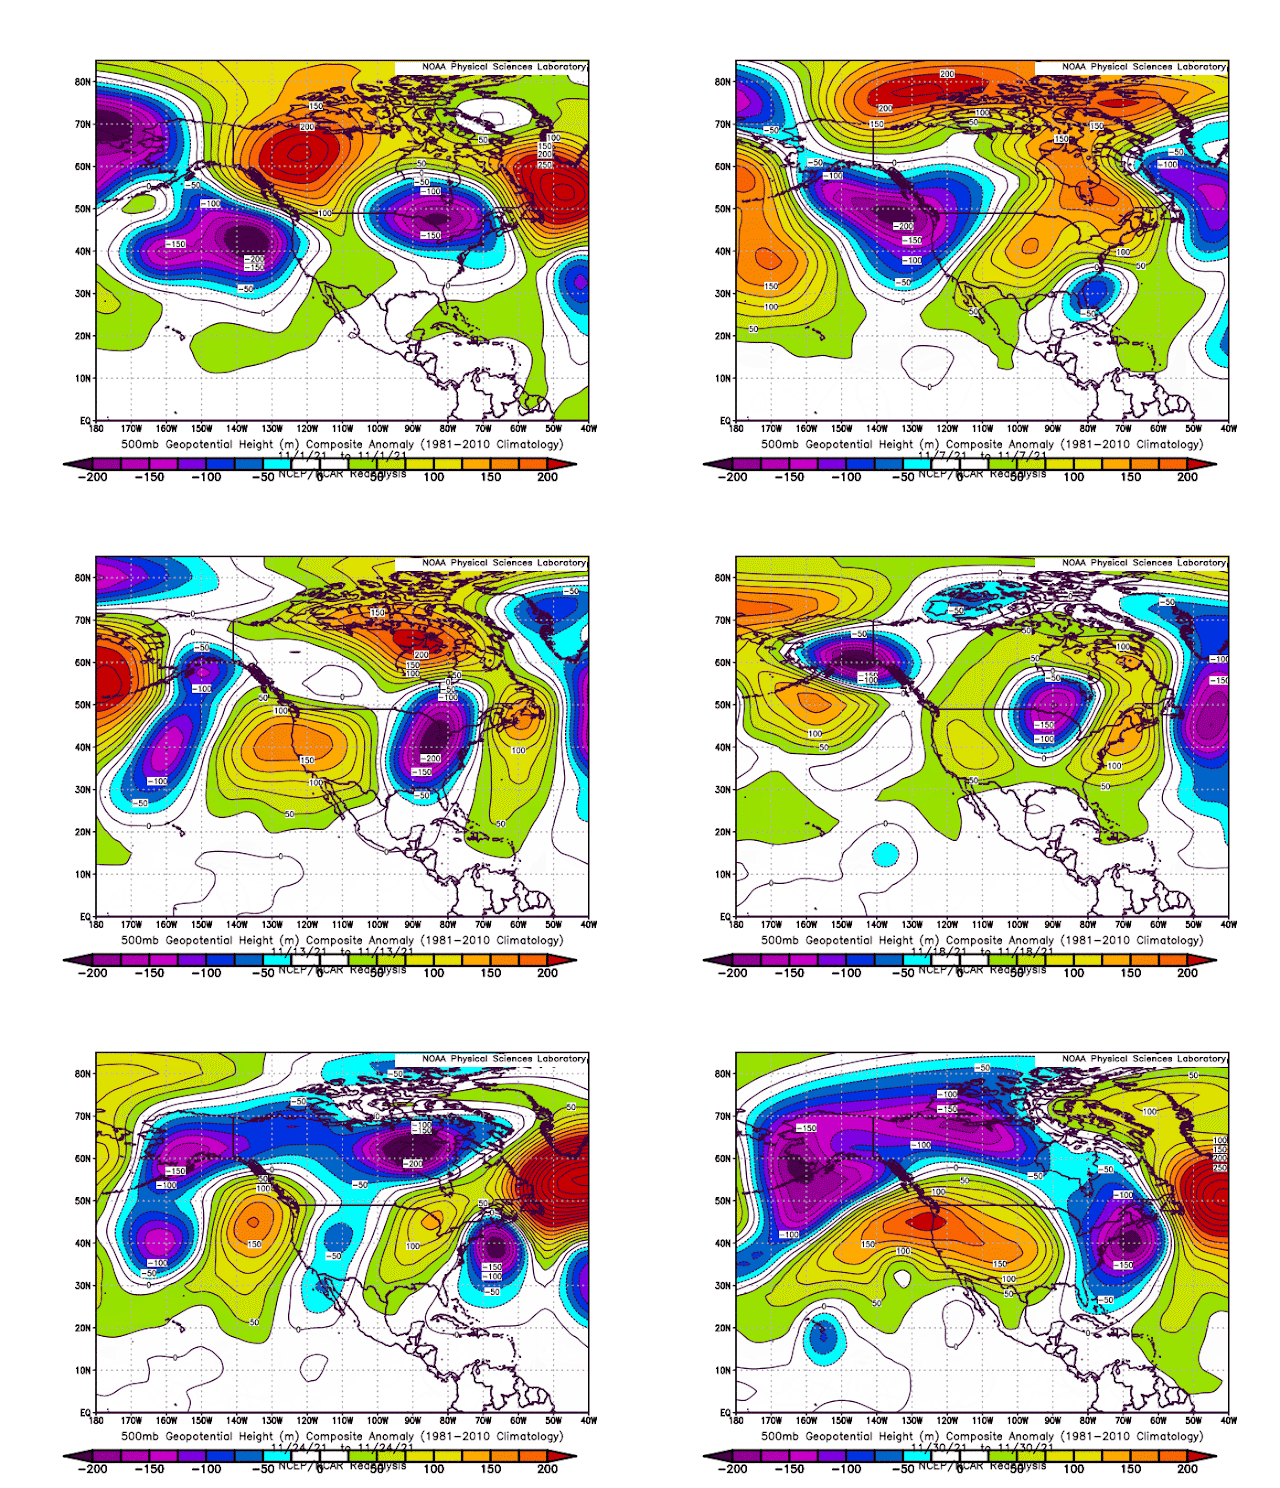
The last week of November showed no Pacific ridge locking this pattern into place.  Look at the low over Alaska and the low off the east coast. 

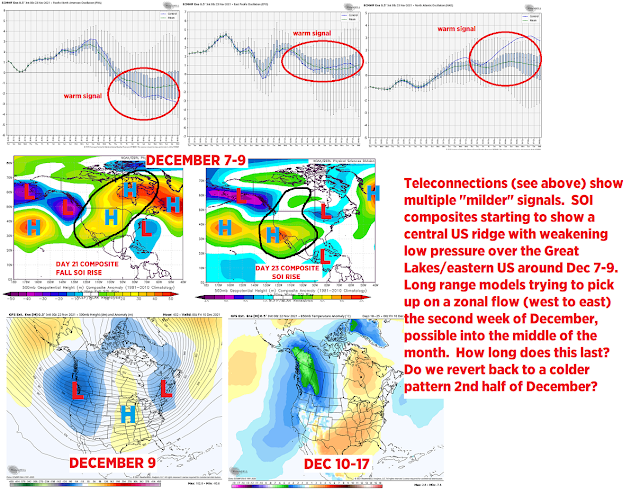
Around that time, the Pacific was giving us signals of warmth for December.  Here is the long range outlook I published on November 23rd


The SOI (southern oscillation index) was signaling, around the same time, the same warmth with brief cooler interruptions. 


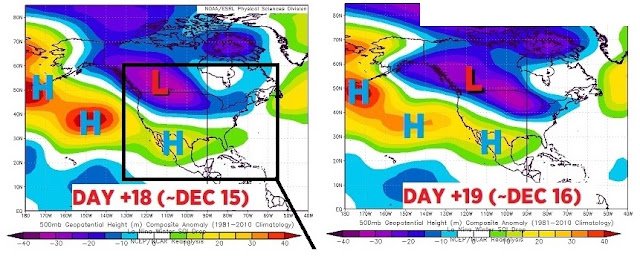
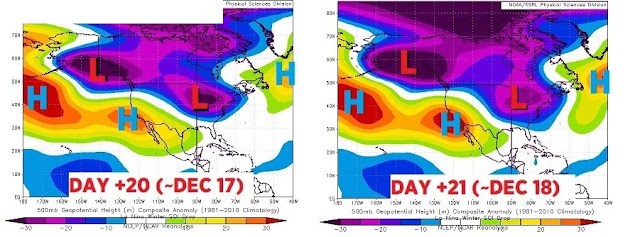
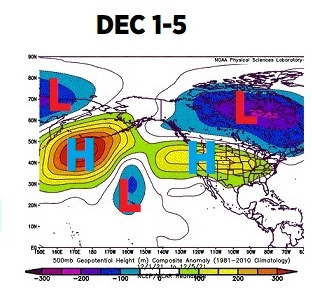
The actual upper level pattern started to change in early December. Western Pacific ridge was popping.  All of this develops in a response to the La Nina background state. BLUE REGION in the middle


By the second week of December, the low retreated into Canada. The Pacific ridge and east coast ridge was building.

DECEMBER 6-10

By the middle of December, two separate high pressure ridges developed.  The main ridge over the northern Pacific.  The other over the eastern US with a western trough.
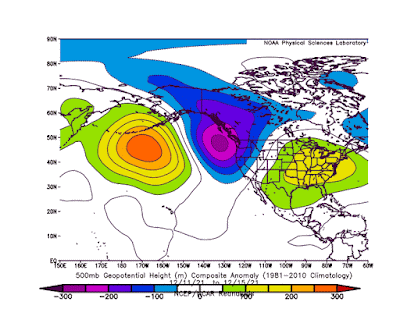
DECEMBER 11-15
The third week of December featured the strengthening Pacific ridge as the eastern US ridge shifted south.
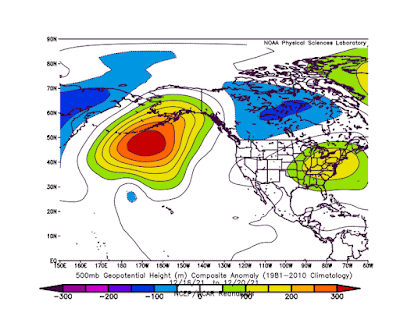
DECEMBER 16-20

December as a whole shows each ridge dominating the pattern.
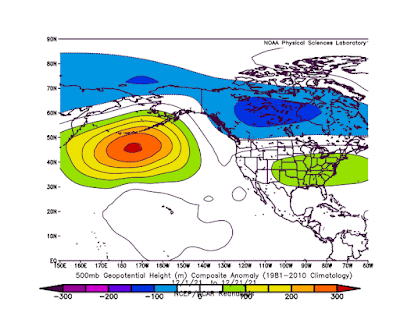
DECEMBER 1-20


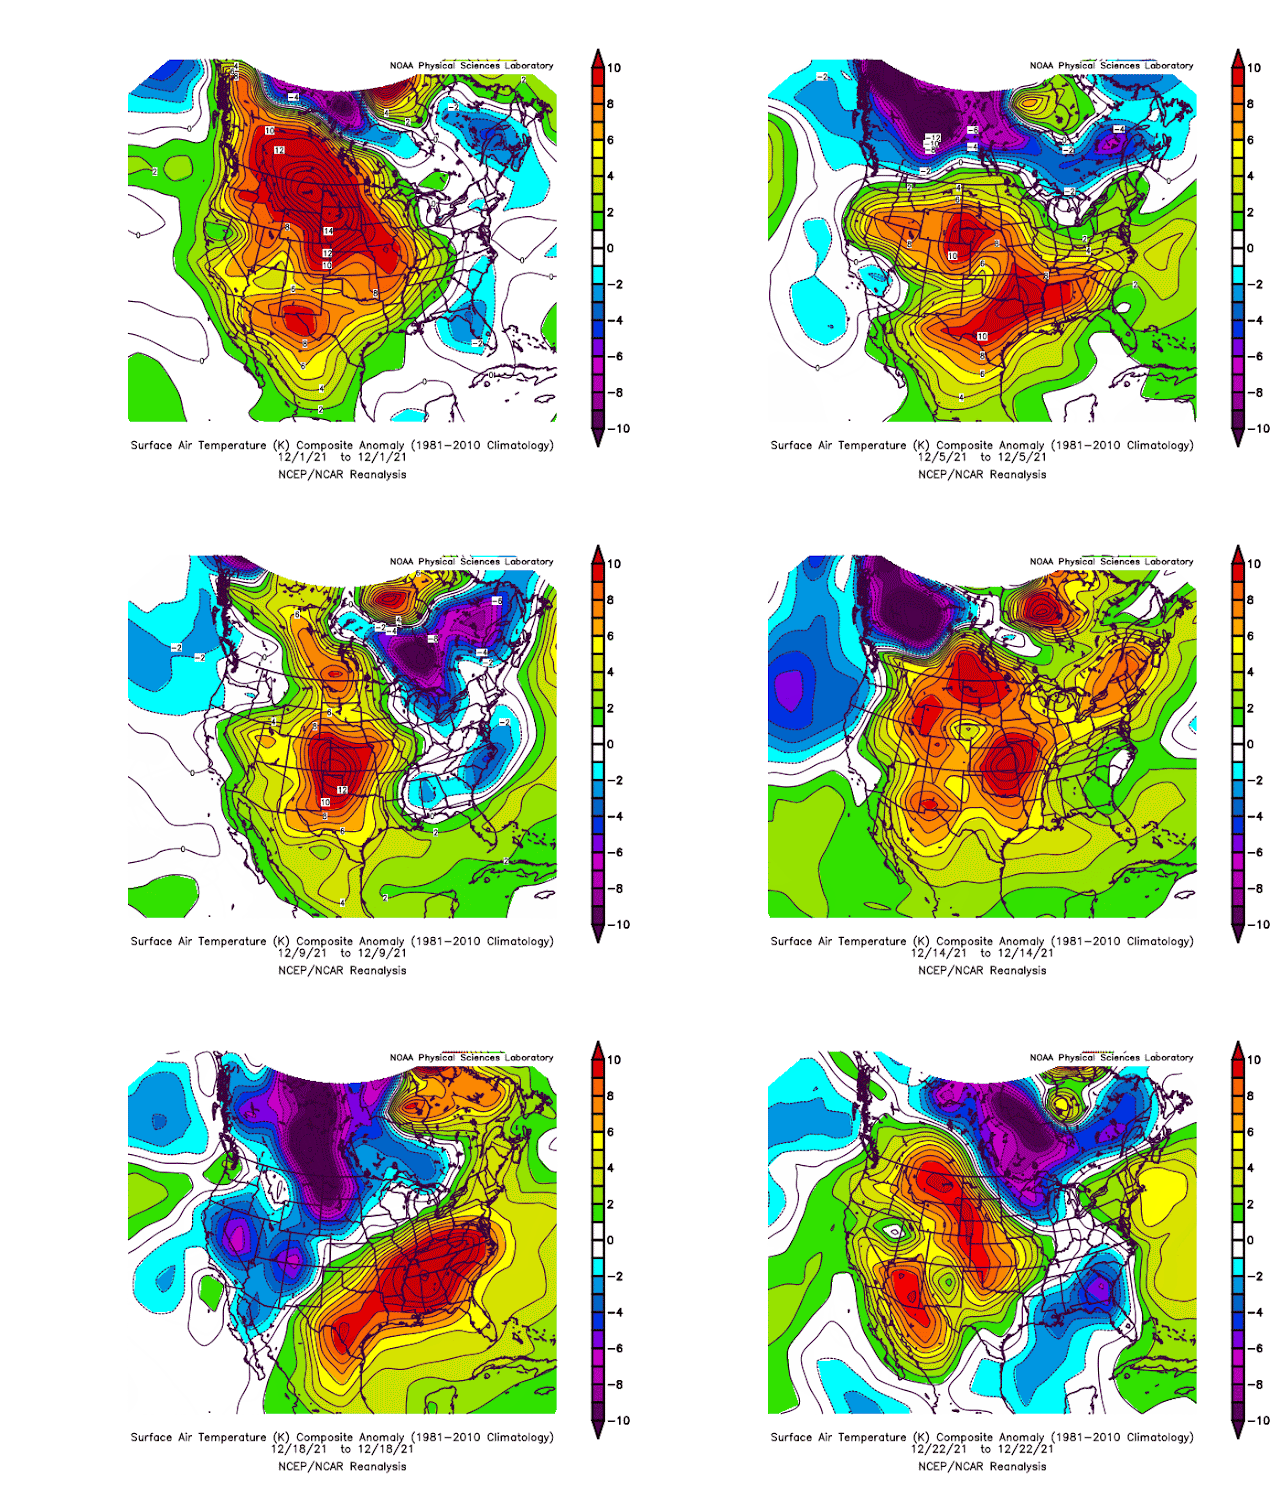
Look how the daily temperatures progressive throughout the month. A few brief colder intrusions but nothing sustainable. 

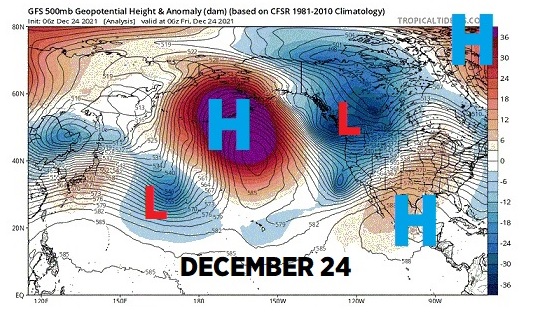
As of this writing on Christmas Eve, the pattern still shows the HUGE Pacific ridge not budging as the SE ridge settles in.


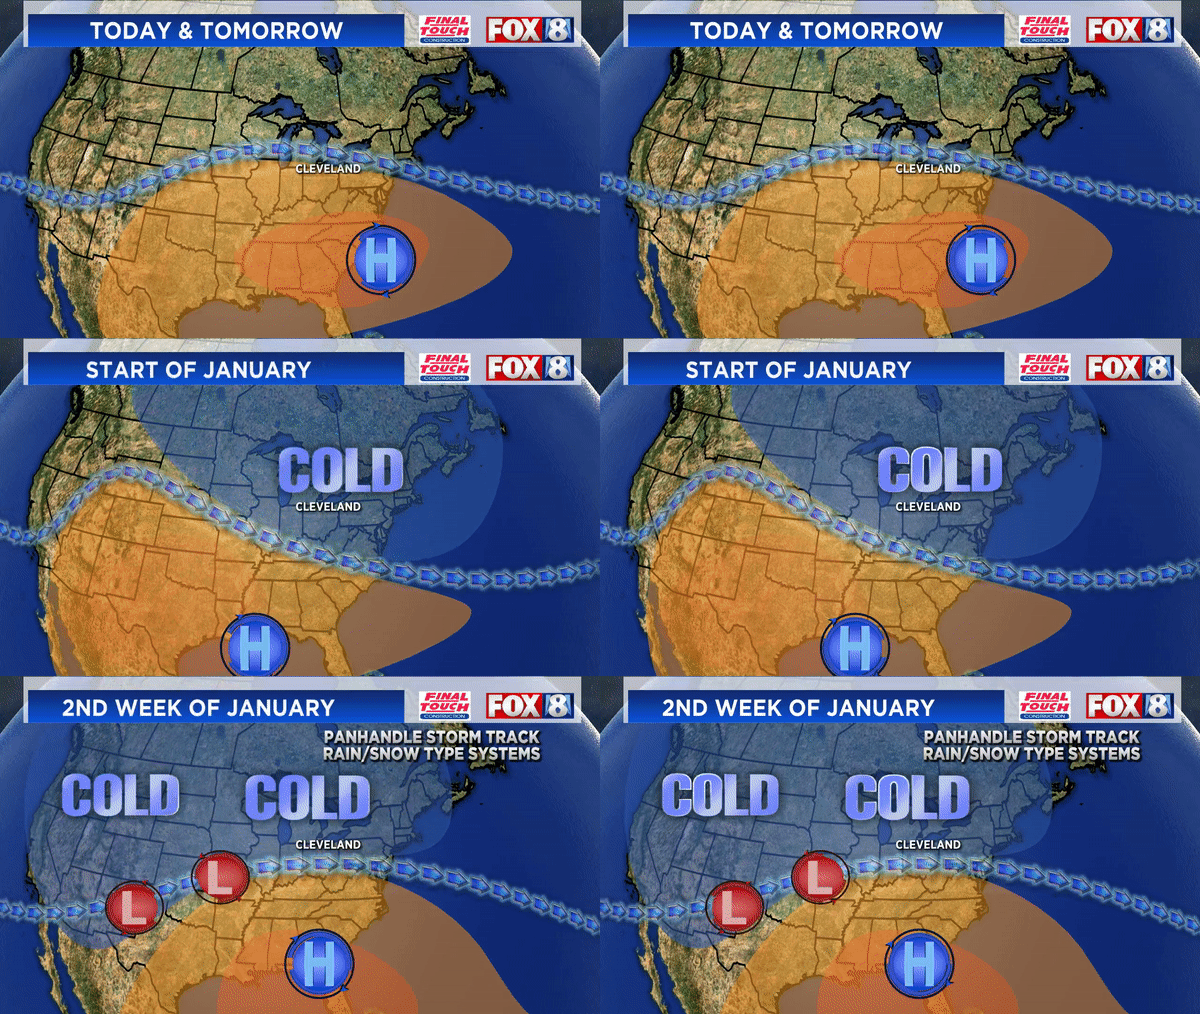
What does this mean overall?  Milder temps continue through the remainder of the month. Models show the SE ridge weakening a bit as we head into January. 


Overall our confidence in increasing for a dominant panhandle storm track in January.  This would feature rain/snow mix type systems from Oklahoma then northeast into the Ohio Valley.


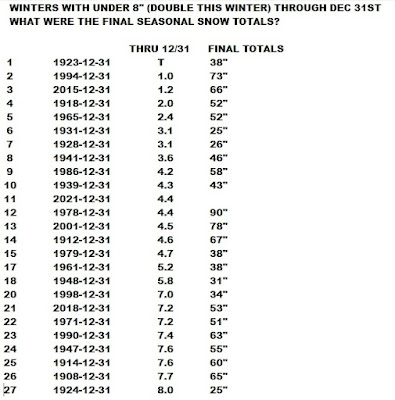
December 2021 has only a trace of snow!  Only two other Decembers have had just a trace of snow.  1931 and 1923.  Just for fun, what was the final winter snowfall after snow totals under 8" through the end of December?


Tuesday, December 14, 2021

Deadly December Tornado Outbreak Recap

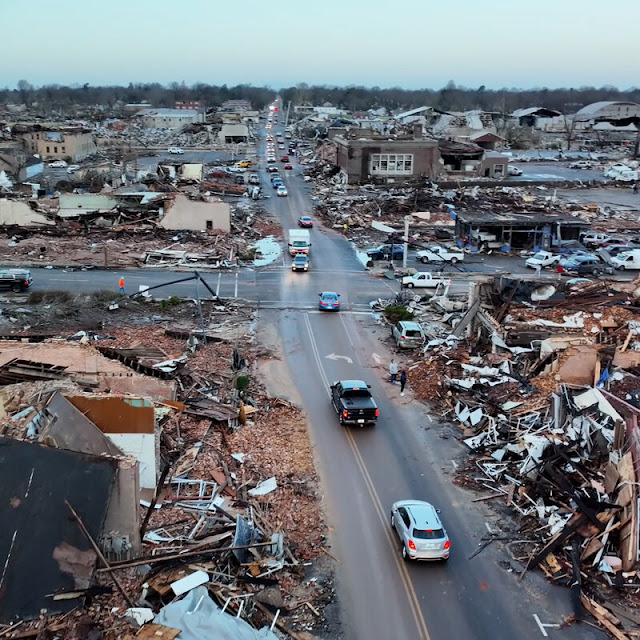
The clean up continues across the south after Saturday's deadly tornado outbreak.


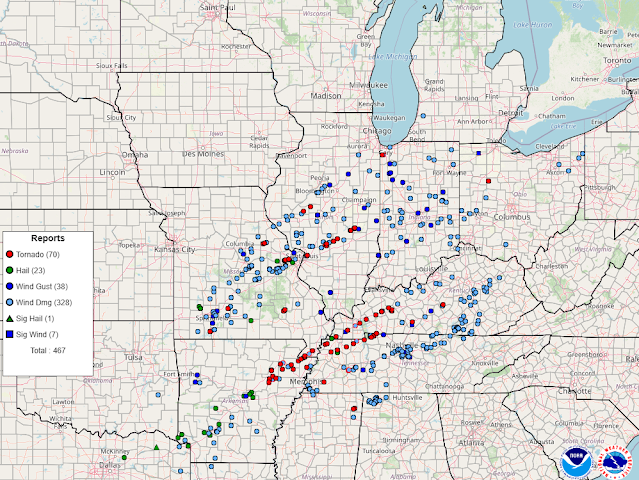
people lost their lives as 71 tornadoes hit after dark between  December 10 and 11 across parts of 4 states. This LINK HERE lists multiple resources on the damage assessments.


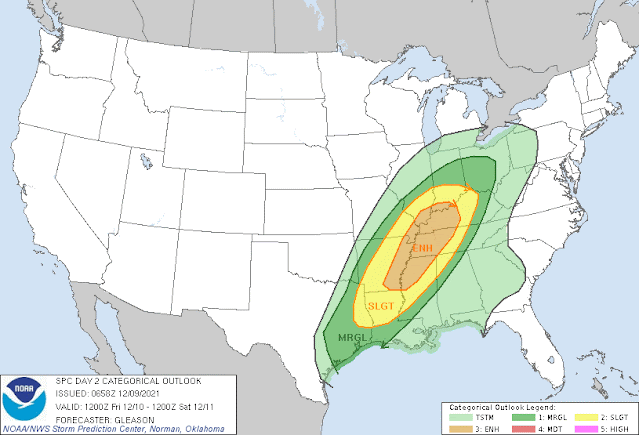
More than 48 hours prior to the event, the Storm Prediction Center started to plant the seeds of potential severe weather.


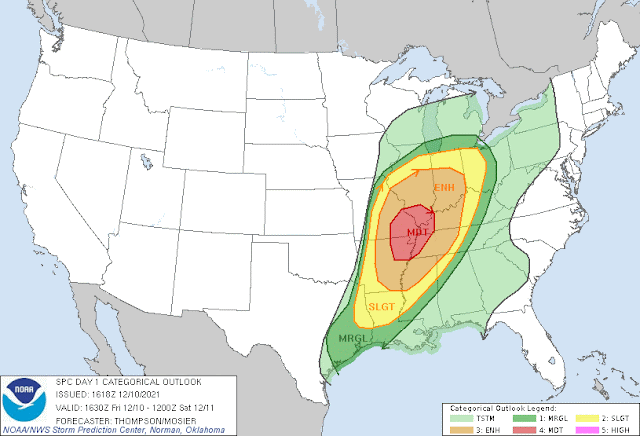
By Friday, the SPC narrowed and upgraded their outlook from Enhanced to Moderate:


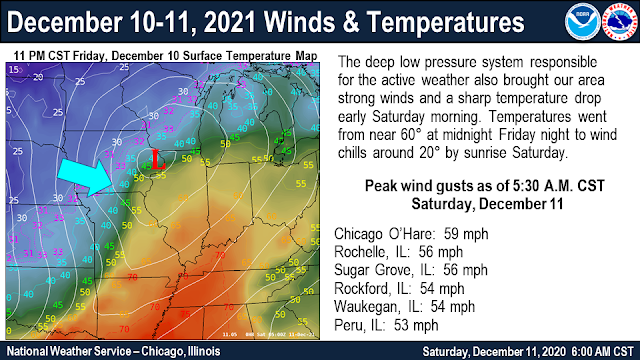
Chicago NWS graphic below shows the HUGE differences in temperature.


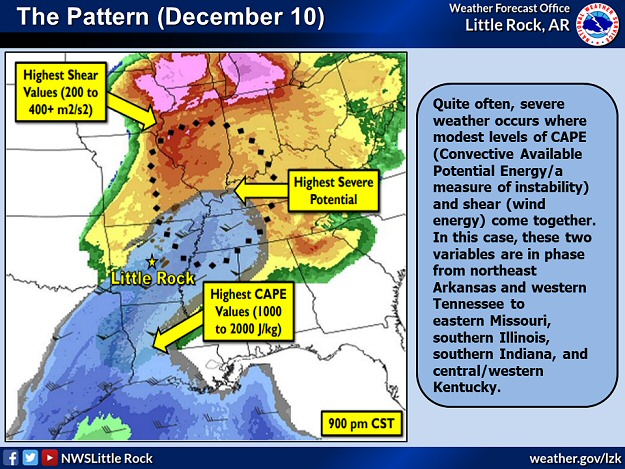
The severe storm parameters were present. Graph from NWS Little Rock, AR.


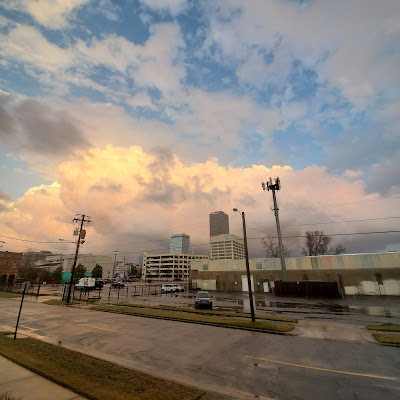
Storms were building in the distance.  Notice the sunshine ahead of the storms. This can create a false sense of security.

Nathan Scott, Little Rock, AR

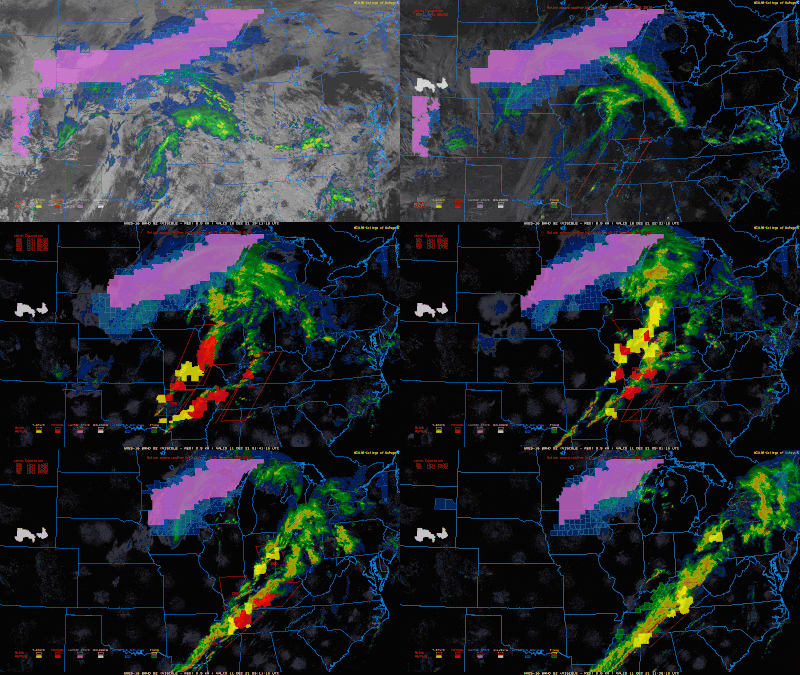
Look at the wide variation in weather occurring simultaneously on December 10-11.  Winter weather watches across the upper midwest.  Rapidly deteriorating conditions in the south as the line of severe storms tracked east.  Notice the tornado watches/warnings in red.


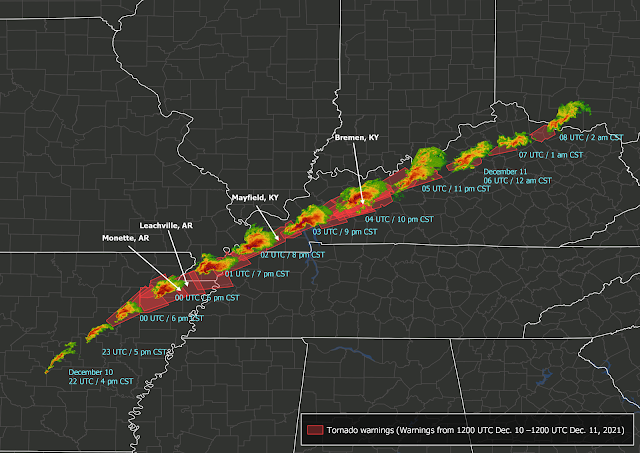
This line which evolved into two separate lines produced large scale damage from western Ohio to southern Arkansas.


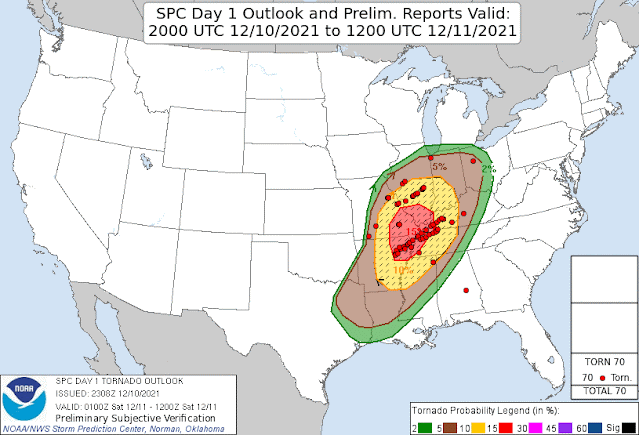
Meteorologists at the SPC and the various other NWS offices across the central US did an amazing job in giving advanced warning. Look at the accuracy of the outlook vs the tornado reports.


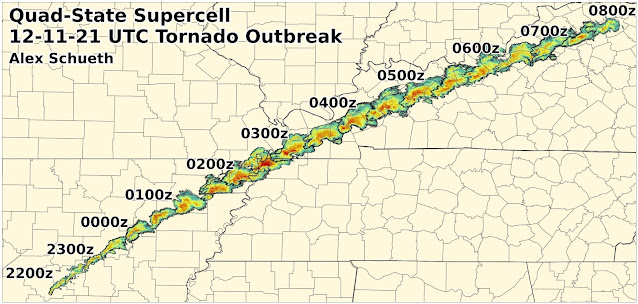
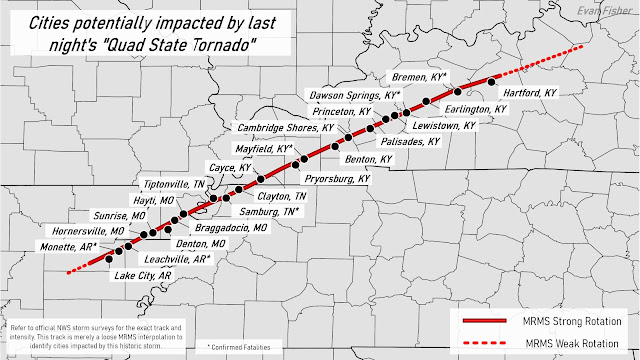
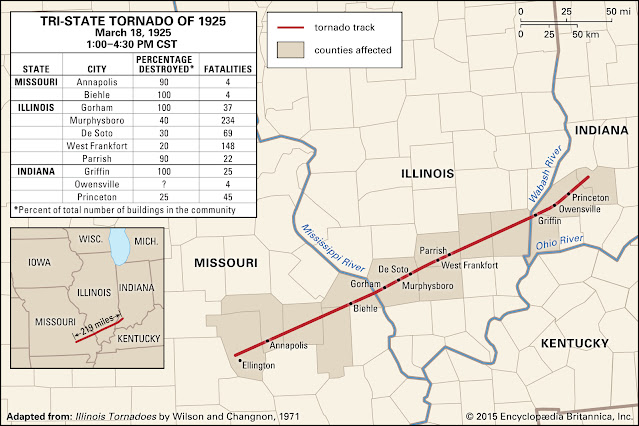
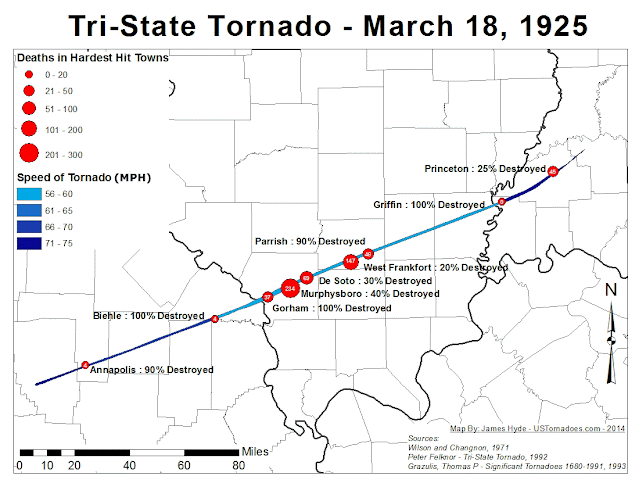
Total path exceeded 200 miles


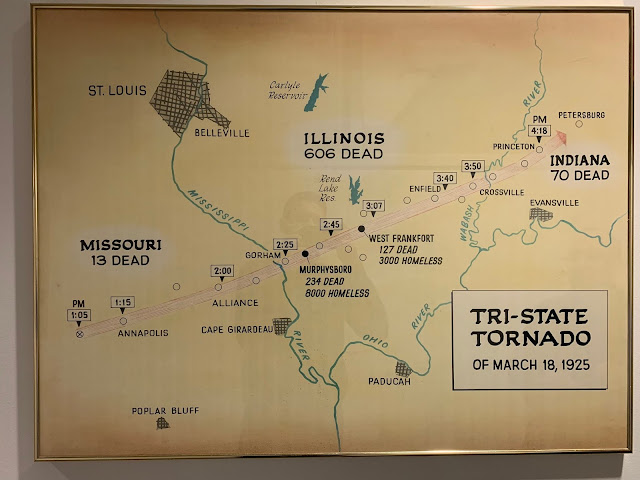
This outbreak could end up breaking the tornado track record set back in 1925


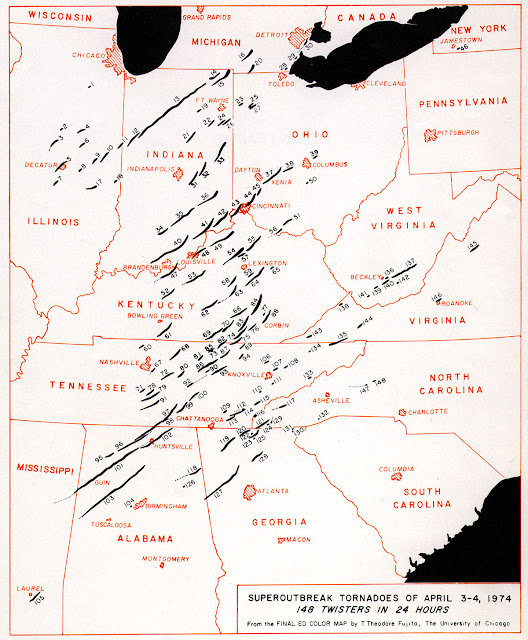
For perspective, here is a map of the tornado outbreak in April 1974


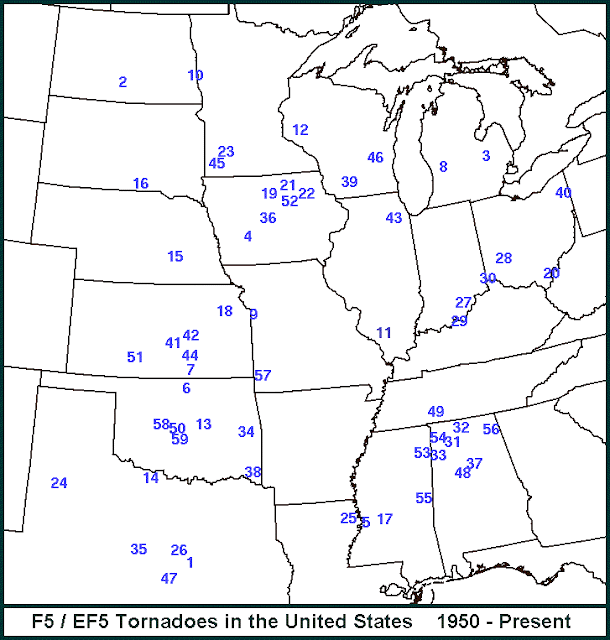
More details will be forthcoming on the strength of the tornadoes. Here is the list and locations of ALL EF4 & EF5 tornadoes.  The last EF5 was May 2013.