
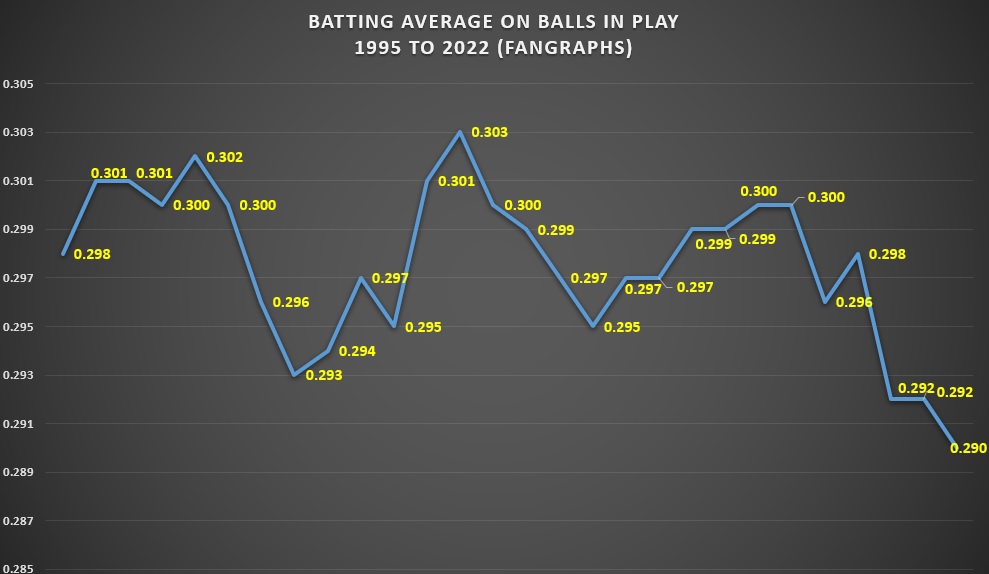
Here are numerous charts showing where the 2022 MLB season compares to recent seasons.
All data is from Fangraphs and Baseball-Reference




 |
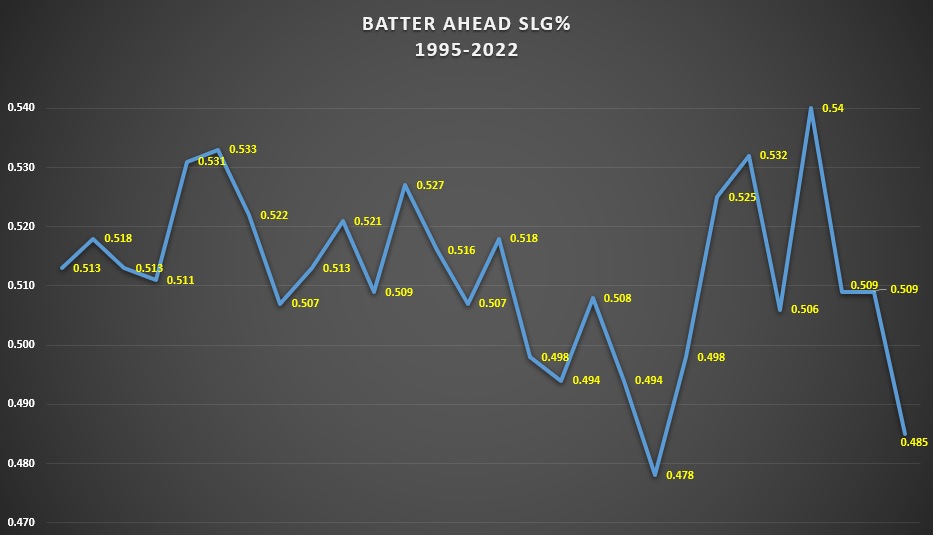


Here are numerous charts showing where the 2022 MLB season compares to recent seasons.
All data is from Fangraphs and Baseball-Reference
|
It's August 18. Two more weeks to go before climatological summer is over. Sure, there will be more heat into September. No need to shut it down yet. For comparisons year over year, we use 3 month increments. Summer climate comparisons use June, July and August. Here are the HIGH TEMPERATURE ANOMALIES across the US August 1 through August 17:
 |
| High Temperatures vs Normal (Thru August 17) |
 |
| Low Temperatures vs Normal (Thru August 17) |
.gif)


Remember the active spring we had? Seems like it was years ago.
Most of northern Ohio had between 1/2" and 2"+ rainfall above normal during the first half of June. The driest areas were eastern Geauga, Lake and most of Ashtabula counties.
 |
| June 1-15 Rainfall vs Normal |
Since the wetter stretch of weather in early June, rainfall has been sparse. Most of the area was running 1-2" below average since June 15th. This was in our long range forecast issued back on June 18th. Rainfall map is below.

Rainfall looking well below normal through the end of June and possibly beyond @fox8news pic.twitter.com/WtsxsqVDD1
— Scott Sabol, Meteorologist CBM/CCM (@ScottSabolFOX8) June 18, 2022
 |
| June 15-30 Rainfall vs Normal However since the start of July, the pattern has reverted back to a spring one albeit briefly. Storm track has brought rain/storms in from the West-Northwest. Below is the July 1-6 rainfall vs normal.  Let's break down the actual rainfall amounts over 3 day periods. I circled the regions where rainfall is between 0.75" and 1.25"  Now July 4 through early July 6th. Circled regions show rainfall between 0.75" and 1.5" and 2-3". Notice the extremely dry conditions across Lake, portions of Geauga and Ashtabula counties. 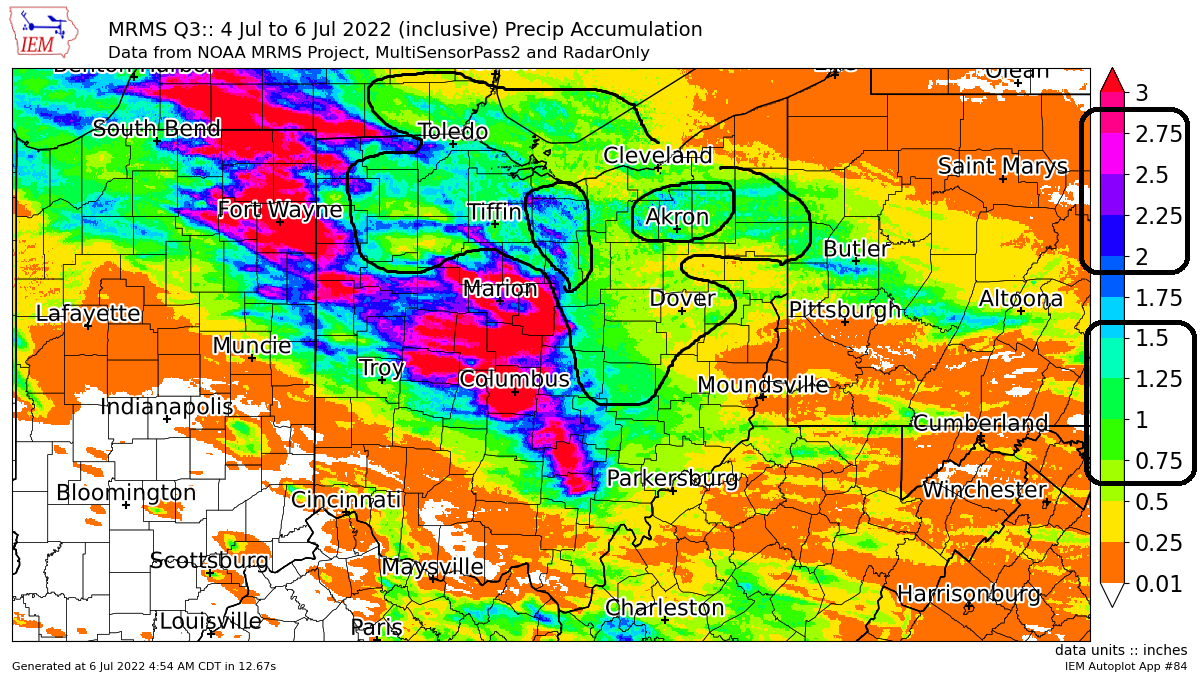 The soil moisture has dropped significantly across the Ohio Valley since mid June. Recent rainfall will help. Duration of rain is key. Since these storms have moved fast, much of rain runs off instead of being absorbed into the ground. .gif) Long range forecast shows rain this week. Beyond Saturday July 9, rainfall remains well below normal through July 19th!  |

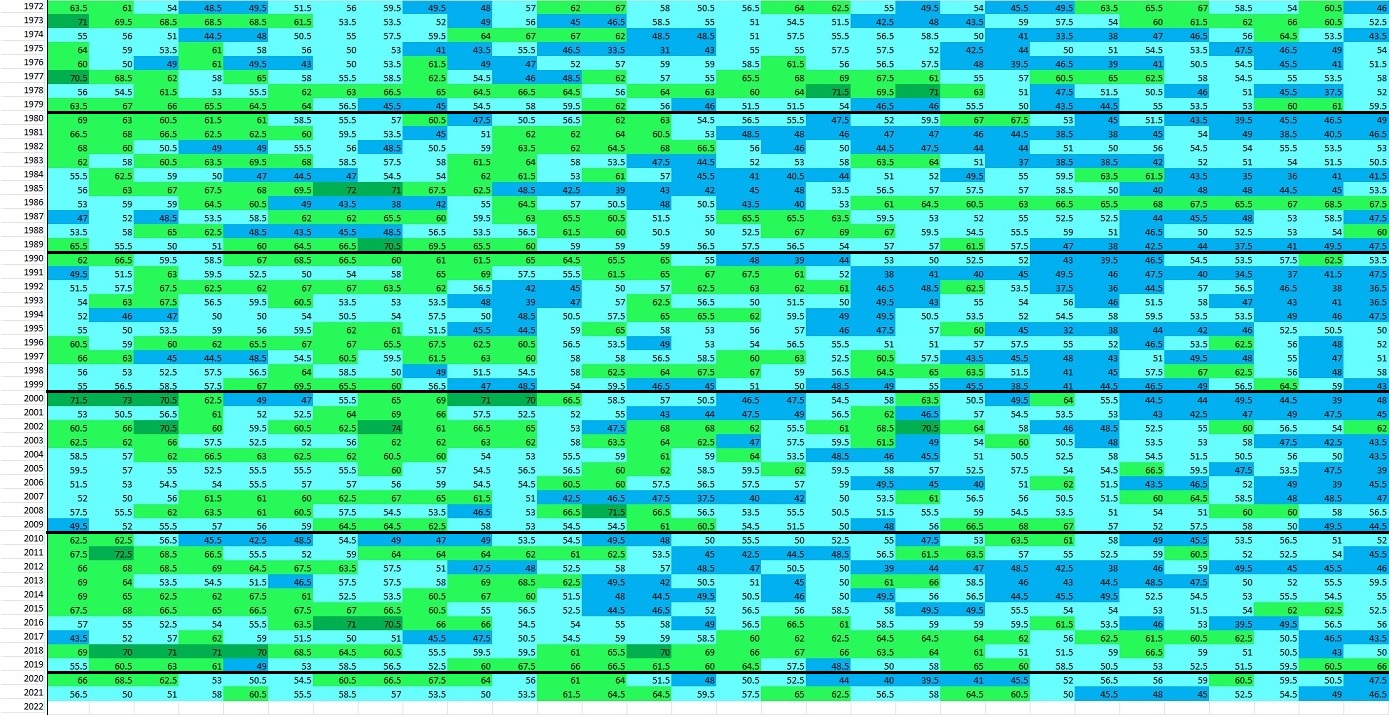
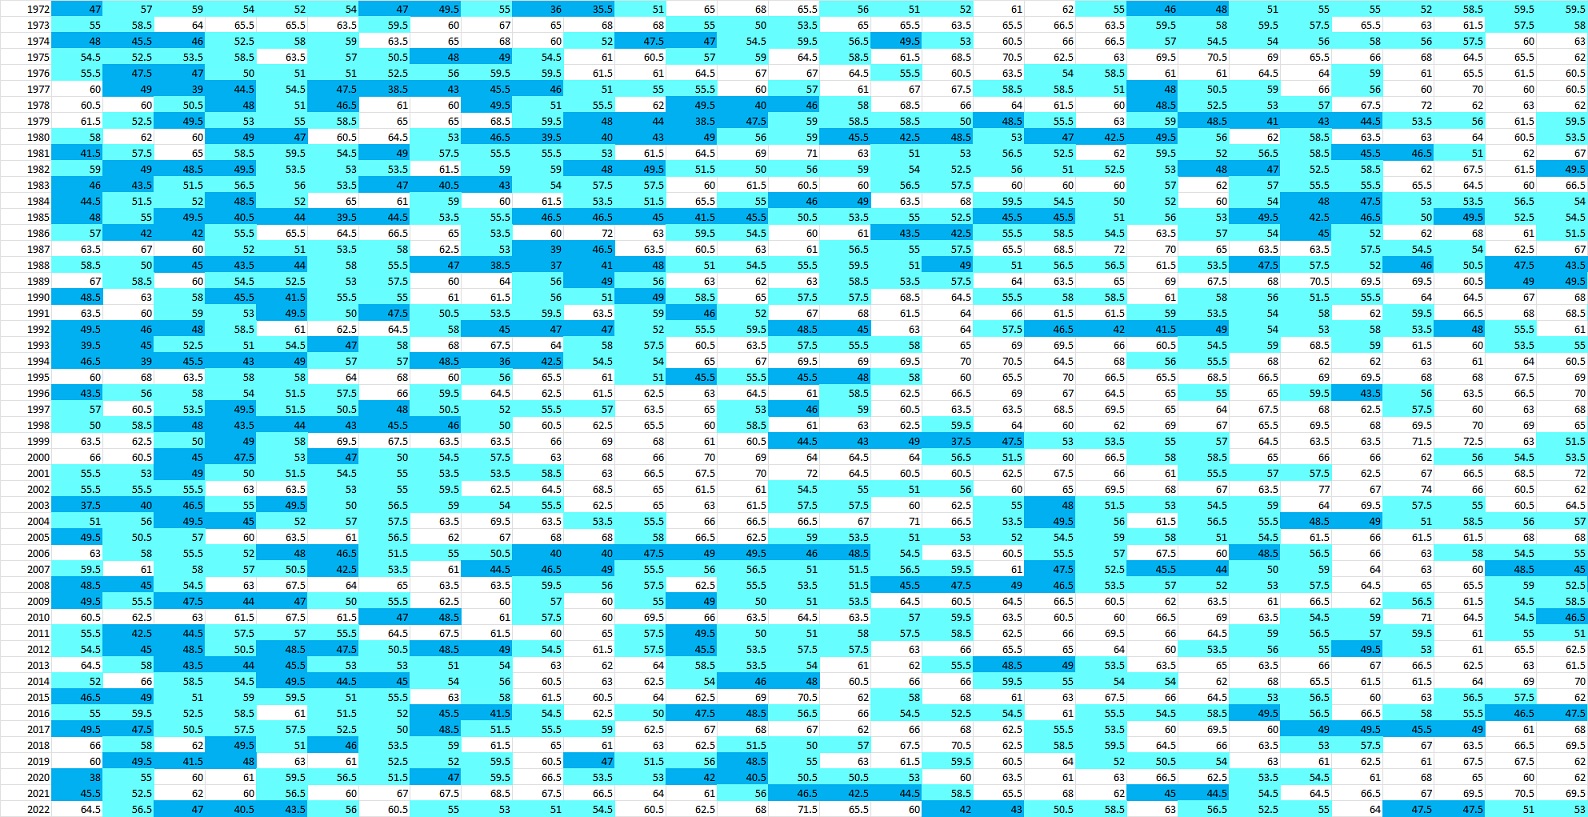
The plots below are the average dew point for each day from June 1 to September 30 since 1972 for Cleveland. I color coded each dew point range for easy reference.
Dark Blue: 30-49°
Light Blue: 50-59°
Light Green: 60-69°
Dark Green: 70-80°
First image is the month of June. Reading left to right for day one through 30. Horizontal black line separates each decade. I notice more breaks from high humidity days in the 1970s and 1980s. More consistently high humidity in the mid/late 1990s into the early 2000s. Recently, lower humidity days seem more frequent in the first half of the month

Second image is July. Over the last 10-15 years the frequency of "lower humidity" days (light blue) seems less than previous decades.

Third image is August

 |
| JUNE DEWPOINTS SINCE 1972 (UNDER 60) |
 | |||
JULY DEWPOINTS SINCE 1972 (UNDER 60)
|
 |
| SEPTEMBER DEWPOINTS SINCE 1972 (UNDER 60) |

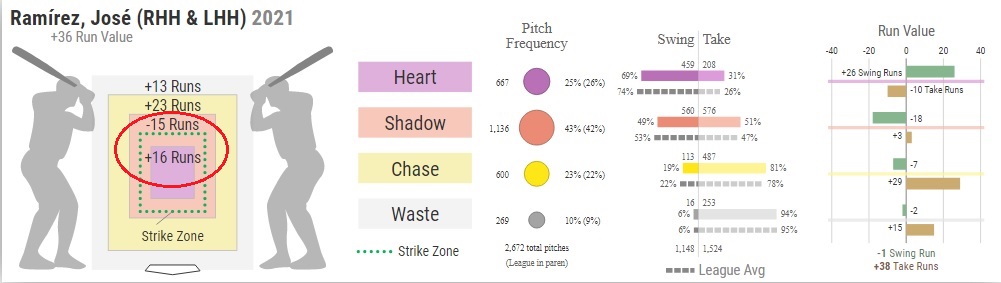
Jose Ramirez is on a torrid pace. He leads the league with 62 RBI. He's second in slugging percentage at 0.649. Looking at more advanced statistics, the story remains the same. His 0.437 wOBA is good for 4th in MLB. His wRC+ of 193 ranks 5th.
What stands out among the top hitters in run creation is their strikeout rate. The average rate of the players below (minus Ramirez) is 19.8%. Jose Ramirez strikeout rate is... 7.4%.




 |
| wOBA Hard Hit% Center Hit% |
 |
| wOBA Hard Hit% Pull% |


 |
| wOBA with runners on base/empty |


