Showing posts with label physics. Show all posts

Thursday, March 18, 2021

Who Really Supplies The Power: The Pitcher or The Hitter?


 I always grew up hearing this from coaches when a power pitcher was on the mound:

"He'll supply the power. Just make contact."


It seemed to make sense. The faster the ball hits the bat the further it will travel after impact.  Except the science says otherwise.

The formula to determine the speed at which the ball rebounds off the bat is:

                                                           vexit = q vpitch + (1 + q) vbat

EXIT VELOCITY (OFF BAT) = ea * PITCH VELOCITY + 

(1 + ea) * SWING SPEED

Where vexit  is the ball exit velocity, vpitch is the velocity of the pitched ball and is the vbat  speed of the bat.  "q" is COLLISION EFFICIENCY

Collision efficiencyvalue is between 1.0 and 2.0 depending on the squareness  of the hit. A well hit ball with a wood bat on the sweetspot gives a value of 2.0.   A detailed explanation of COLLISION EFFICIENCY is in this paper.  I used a value of 1.5 for q with graphs below.

So what does this formula tell us?  It shows mathematically that the batter's swing speed is 6 times more important than the pitch speed in creating higher exit velocity!

Graphs below show the exit velocities for 5 several bat speeds (60, 65,70,75,80 mph) as pitch speed increases from 65 to 100 mph. 


Notice how flat the exit velocity increases are for each bat speed. While there is an increase as the pitch speeds increase (pitch speed does have an influence) it's not a large one.

When we increase both the pitch speed AND the bat speed, the exit velocity increases more sharply.

So for a pitch speed of 65 mph and a relatively show bat speed of 60 mph, the exit velocity after a decently hit ball would be around 79 mph. An increase the pitch speed to 85-90 mph with a commensurate increase in bat speed to 70-75 mph would yield an exit velocity above 95 mph. Similarly a bat swung at 80 mph making contact with a 95 mph pitch would cause the ball to leave the bat at 105+ mph.  

Bat speed not pitch speed supplies most of the power!


Wednesday, December 17, 2014

The Different Faces of Central Pacific El Ninos

A few weeks back, I had an email conversation with Professor Jin-Yi Yu of University of California Irvine.  I ran across his website and 2009 El Nino paper on Central Pacific El Ninos and was looking for some additional information on what the difference is between a Central Based El Nino and a "Modoki" El Nino according to his work. If you remember, the current Central Pacific El Nino was and still is a significant variable in our winter weather outlook. This is what he had to say after I emailed him the sea surface temperature analog composite for January asking him if this was a Modoki pattern we've heard so much about in the media:


"...this SST anomaly pattern is a Central Pacific El Nino pattern,
not a Modoki El Nino pattern. The Modoki pattern requires the warming in
the central Pacific to be flanked by cooling in the eastern Pacific and
western pacific
".
This graphic illustrates the differences between both El Ninos. El Nino Modoki on top, Eastern El Nino (typical El Nino) on bottom. Notice the cooler water flanking the relative warmth in the middle of the Pacific near the dateline.


Dr. Yu's 2012 paper summarizes each of the 21 El Nino events since the early 1950s using three El Nino Indices. The El Nino Modoki Index (EMI Method), the basic Nino method using the Nino3/4 sea surface temperature readings and the EP-CP Index derived by Dr. Yu and his colleagues published in his 2012 paper. I highlighted the seven consensus Central Pacific El Nino events across all three indices.

7 Consensus Central Pacific El Ninos (The paper above describes what thresholds are used in identifying EP or CP El Ninos.)
While the list above doesn't identify specific Modoki El Ninos among the Central Pacific El Ninos, checking the average sea surface temperatures starting in September and overlapping each month through February/March, "Modoki type" temperature signatures (cold pockets flanking warmth near dateline) can be seen.  Below are the seven consensus Central Pacific El Ninos in chronological order. Each evolved differently. Each one has central warmth (2009-10 was the warmest). Only 1958-59, 1963-64 and 1977-78 seem to have the strongest "Modoki" signature (cool pockets east and west) by visual inspection.

One other note, notice the warmth along the west coast of North America in 1958-59, 1963-64, 77-78 and partially in 2009-10. Professor Yu shows in this paper that this warmth is connected to the development of the Central Pacific El Nino. The coastal warmth is associated with the North Pacific Oscillation teleconnection.

MODOKI signature present
Weaker MODOKI Signature. Not as strong as 1958-59

Weaker MODOKI Signature
Strong Modoki Signature
Weak MODOKI Signature

Weak MODOKI Signature
What can we say about these seven events?  The central warmth seems to mature in January. The cool pools east and west were firmly established by October in the first four events (1950s through the late 1970s).

What about our current event?

The central warmth us weaker than 2009-10. The coastal warmth is off the charts due to the North Pacific Oscillation index rising to the highest levels ever for November going back 60 years! The cold pools east and west are showing some signs of developing.  As of mid December, the Modoki signature comparing all three sea surface temperature regions to the other seven events is weak.

The next 6 weeks will be critical in determining whether this Central Pacific El Nino will continue to mature into a formidable driver of the early 2015 winter pattern. Based on past analogs, it should.


Tuesday, May 20, 2014

Never Trust A Warm Front--Heavy Rain Again!

"Never Trust A Warm Front"!

These words of Dick Goddard and Andre Bernier have also been echoed by myself over the years after forecasting many heavy rain and nighttime severe weather events in northern Ohio, West Virginia and St. Louis going back more than 20 years.

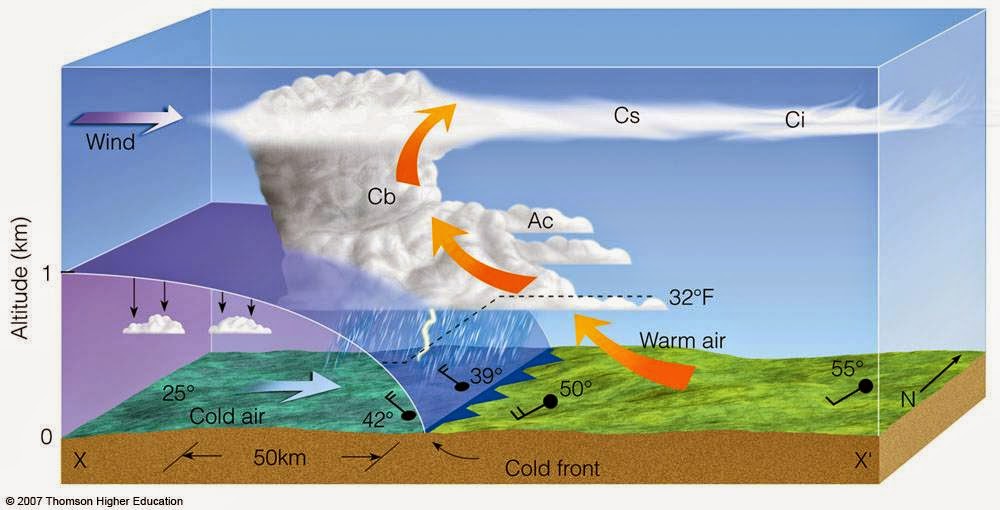
Why are warm fronts so tricky? The dynamics of a warm front are completely different than a cold front. The cross section of each tell the story on how the air is stacked above each front. A more detailed technical discussion is located on this site with a nice powerpoint download.

Cold Front Cross Section
Warm Front Cross Section
Clusters of "blob-like" storms tend to develop along warm fronts. These clusters start vie for position and dominance as they move into areas more conducive for sustainability. One cluster robs another of energy/moisture in order to sustain itself while other might shrink.  Yet several clusters might merge together to form one super cluster as was the case on Monday, May 12th. Radar loop is over approx 40 minutes from 8PM to 8:40PM over northern Ohio.


The combination of a moisture-laden atmosphere, rapidly rising and divergent (separating air) at the top of the storms along with hyper-local changes as the storms evolve over a small area make these clusters very difficult to predict more than a few hours in advance in many instances. Their non-linear nature makes it very difficult to determine an accurate track and duration.  They can become especially powerful during the overnight/predawn hours. The high resolution NAM below (future radar) shows several clusters overnight Tuesday into Wednesday more than 24 hours in advance. Their movement is usually west to east or northwest to southeast along the warm frontal boundary.


Compare that to what a "typical" line of storms looks like along a powerful cold front.


So watch the radar below tonight and early Wednesday for the "cluster-type" setup. These clusters can accelerate and morph into hail producing, high wind storms easily reach severe limits.

I GUARANTEE THAT SOME LOCATIONS WILL RECEIVE MORE THAN 1" OF RAINFALL ON WEDNESDAY!


Central Great Lakes sector loop