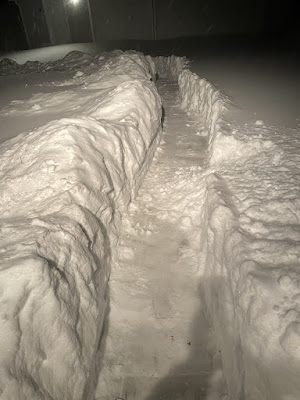
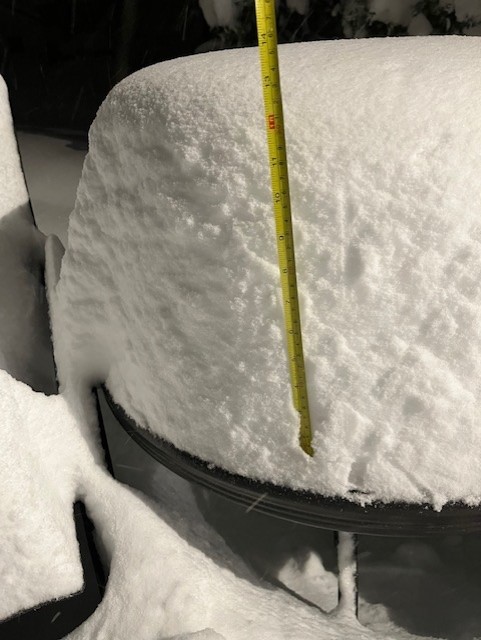
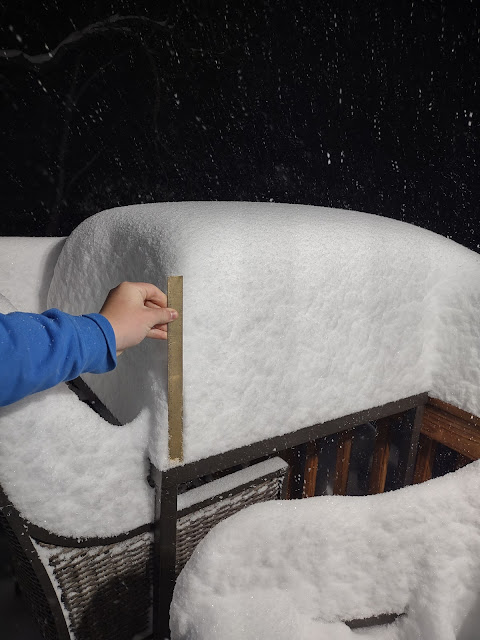
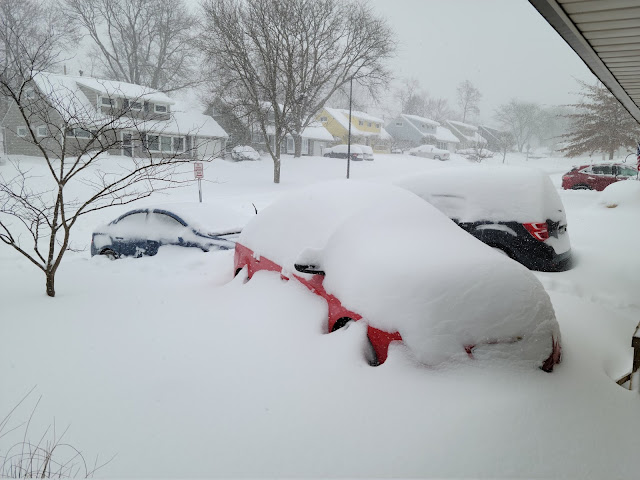
Snowfall across northern Ohio started out impressive in late November. More than 60"+ inches of snow fell in parts of the snowbelt. The most in parts of eastern Lake and the northern 2/3rds of Ashtabula county since the record setting lake effect event in November of 1996.
Photo: NWS Cleveland
Snow across northern Ohio and the Great Lakes started out with a bang in November and December. Here are some great images from Meteorologist Ben Noll showing snowfall vs normal by November 22 around the Great Lakes and nationally.
Snowfall vs Normal through November 22
After the big snow at the end of the month, snowfall recovered fast. Blue and Purple areas indicated WELL ABOVE seasonal snow.
Nationally through December 10:
Here is the snowfall vs normal map through December 18th:
Now snowfall vs normal through January 1st. Notice how the departures began to drop around the Great Lakes snowbelt areas. Below normal snowfall the latter half of December. The November snow kept the overall seasonal totals above normal.
National snowfall numbers also started to drop.
The snowfall decline accelerated in January. The snowbelts still had spots with seasonal snow above normal driven by the late November snows. Snowfall was well below normal since January. Much of the interior regions were running well below normal snowfall by early February.
The middle of the US, upper mid-west and most of the Ohio Valley was well below normal by early February.
By March 1st, the seasonal snow across the Great Lakes was almost back to normal. Snowbelt of northern Ohio, PA and western New York only slightly above due to the late November snowfall.
Seasonal snowfall across the US east of the Rocky Mountains through March 1 is characterized like this:
Well below normalsnowfall in the central US, upper mid-west, Ohio Valley including Pennsylvania, New Jersey and parts of New England.
Slightly above normal snowfall in the Great Lakes snowbelts due to early season snow. Below normal snowfall since January 1st.
Above normal snowfall in the south from southern Missouri, Arkansas, Kentucky and Tennessee.
Above normal snowfall along the gulf coast due to the late January record snowfall:
Ohio and Pennsylvania snow depth animation from November 20 through March 3:
My next post will dive into northern Ohio snowfall further comparing this year to years similar
February 28 featured temperatures in the lower and mid 60s with thunderstorms. A handful of thunderstorm warnings with ONE tornado warning in Knox County around 6am February 28. This tied the earliest tornado warning of the season (2011 was the other year)
Severe weather across multiple states.
Temperatures dropped quickly from mid 60s to the 20s by early evening across northern Ohio. Scattered snow showers develop in the evening with a heavy band of lake effect by February 29 between 5 and 8am.
The drop in temperature impacted the entire Mid-west, Ohio Valley and Great Lakes. Here is an animation showing the temperatures from 2:45pm Tuesday 2/27 through 2:45am Wednesday 2/29:
Radar loop for the northern Ohio shoreline the following morning (Thursday AM) shows a significant band of lake effect snow:
How often do we go from TORNADO WARNINGS to SNOW in 24 hours? Here is the short list:
How about TORNADO WARNINGS to SNOW in 48+ hours?
So its been 7 years -- March 3, 2017 -- since we had measurable snow 24 hours after a tornado warning!
So what happened? Why did the snowfall amounts trend higher?
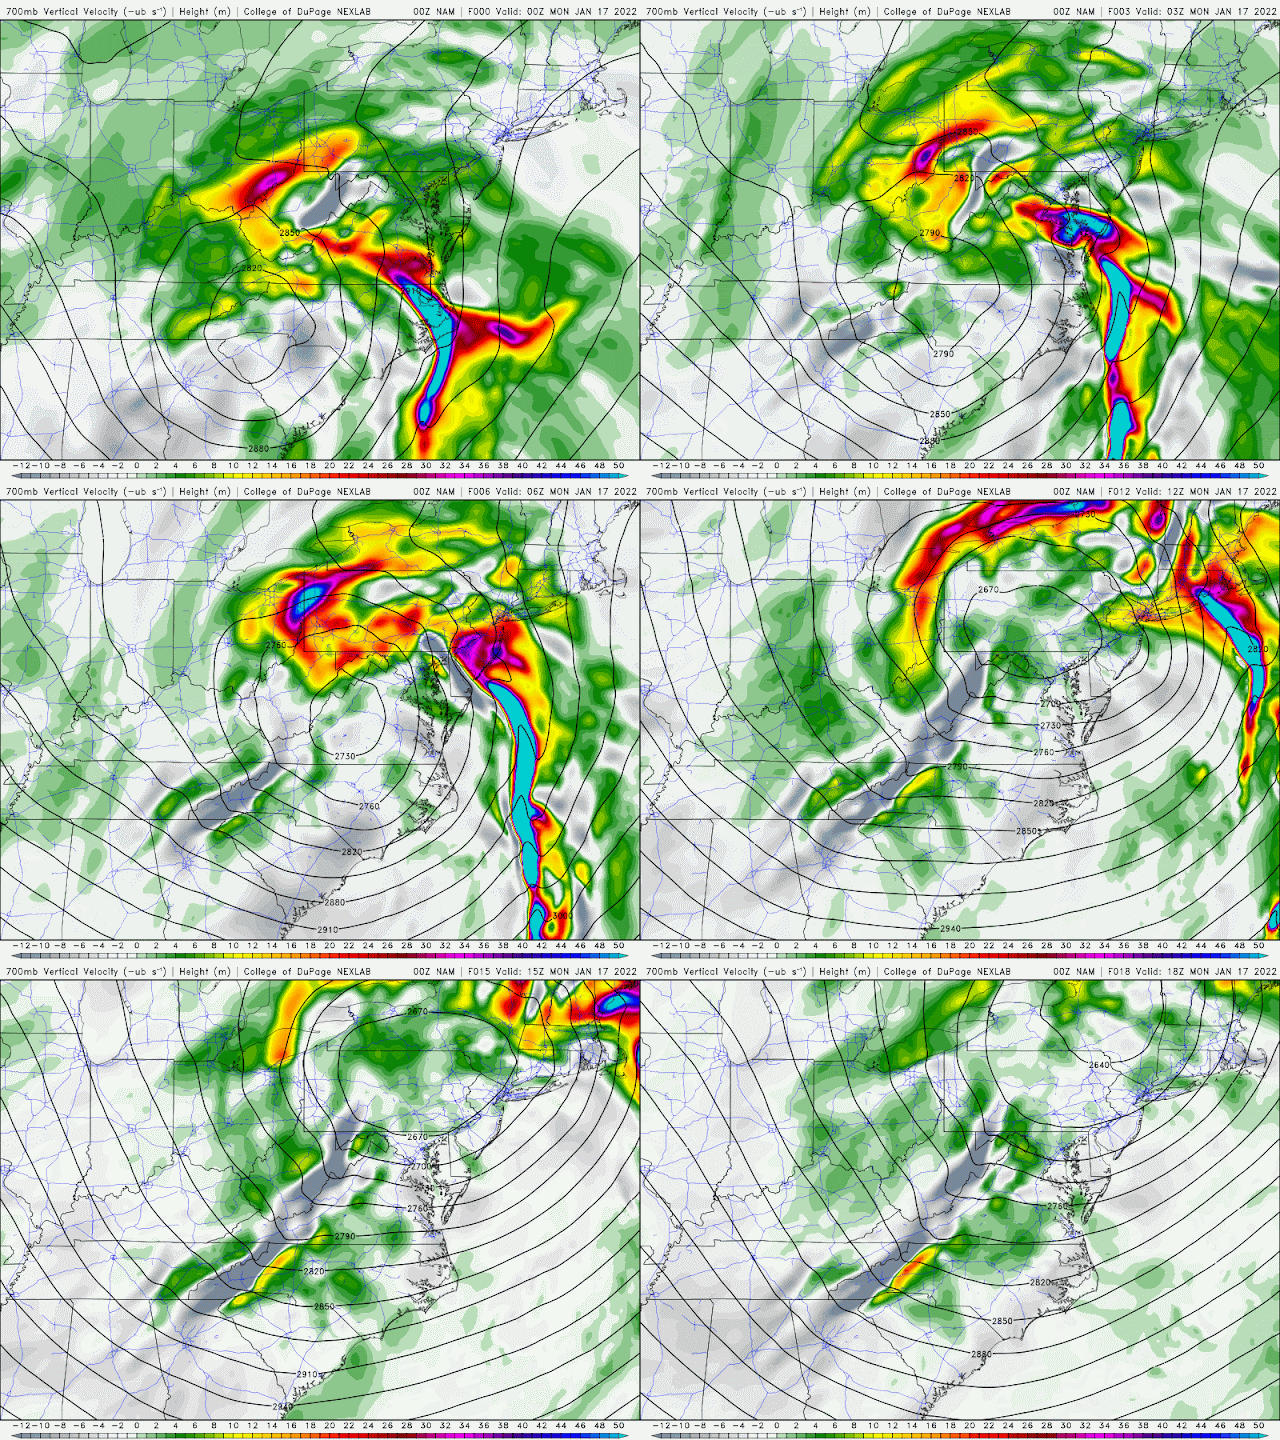
Late Sunday evening model started to show rapidly rising air (10,000 feet) on the northwestern quadrant of the parent low Sunday night/early Monday: The warmer colors along the Ohio/PA line was the catalyst for the heavier snow burst overnight. Watch the warmer colors spinning around low. This greatly contributed to the 4-5 hour window of snowfall rates of 1-2" per hour!
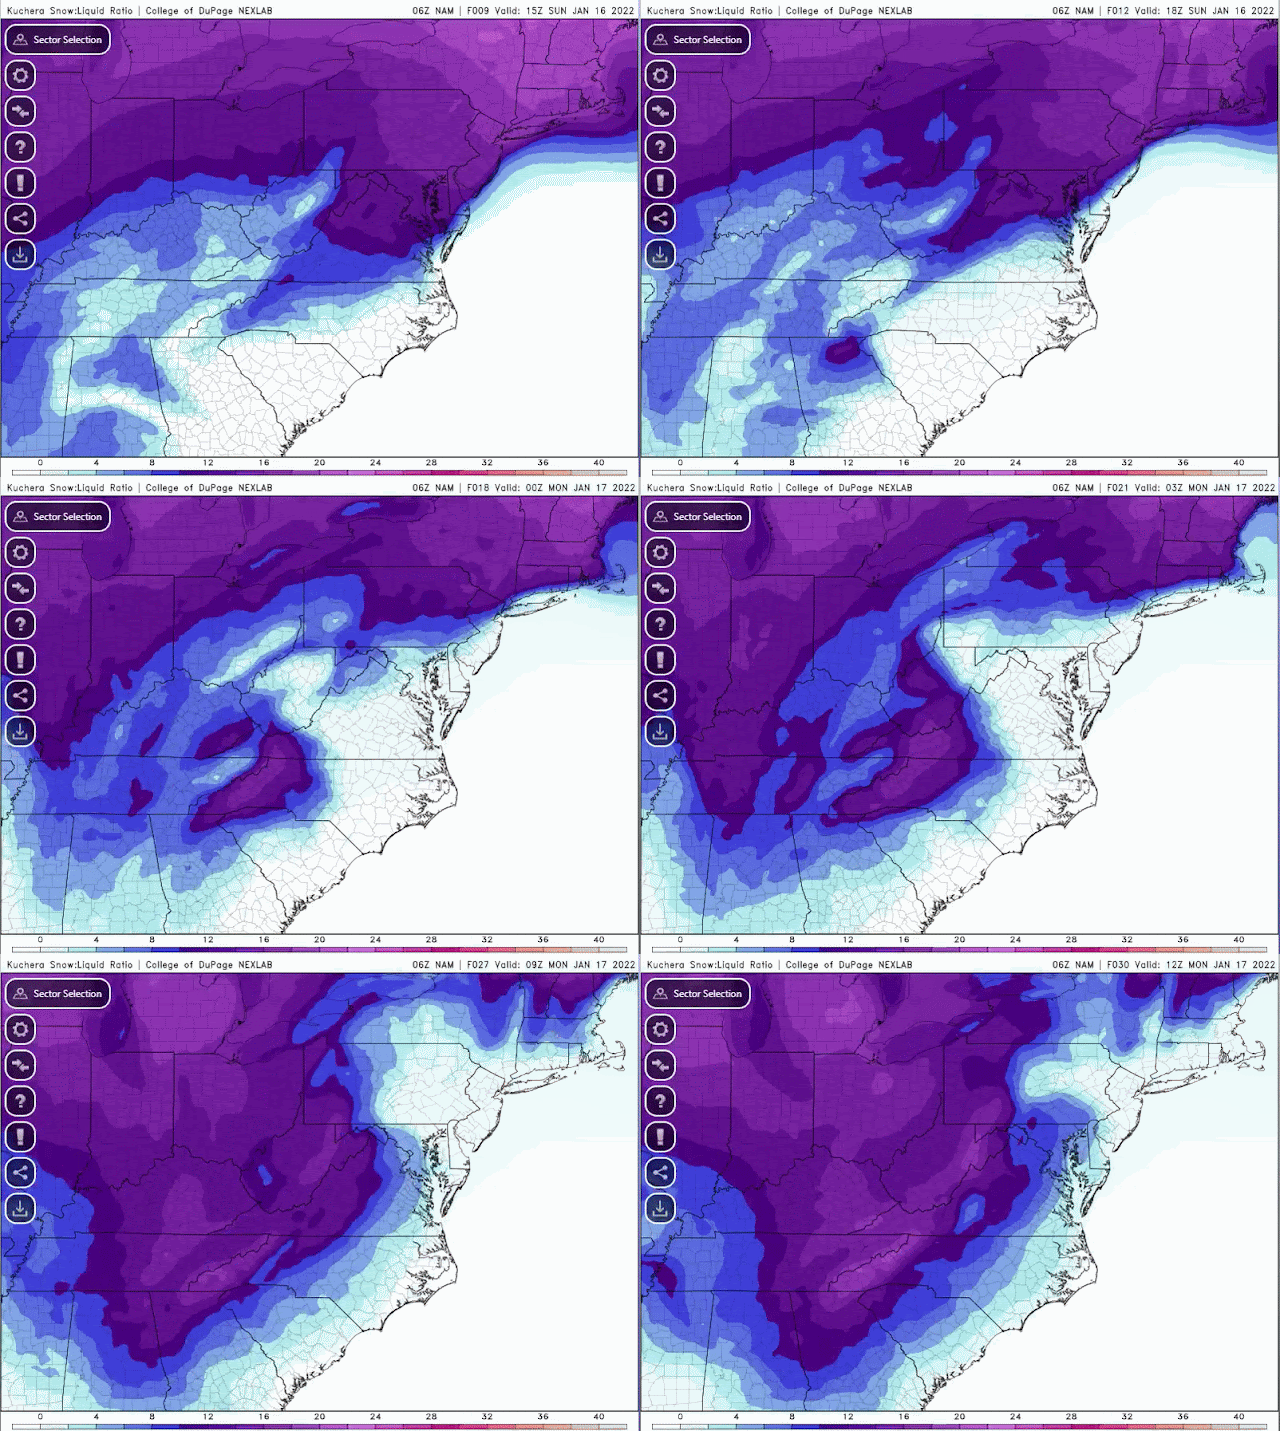
Snowfall ratios changed throughout the event. The traditional snowfall ratio of 1 inch or water to 10 inches of snowfall doesn't always work. Sunday evening/night/Monday morning, the ratio went from 6-8:1 Sunday evening/early overnight to 10-12:1 Sunday late night/early Monday morning then 12-15:1 Monday morning. Snow type went from wet snow/sleet to heavier snow then fluffy snowfall.
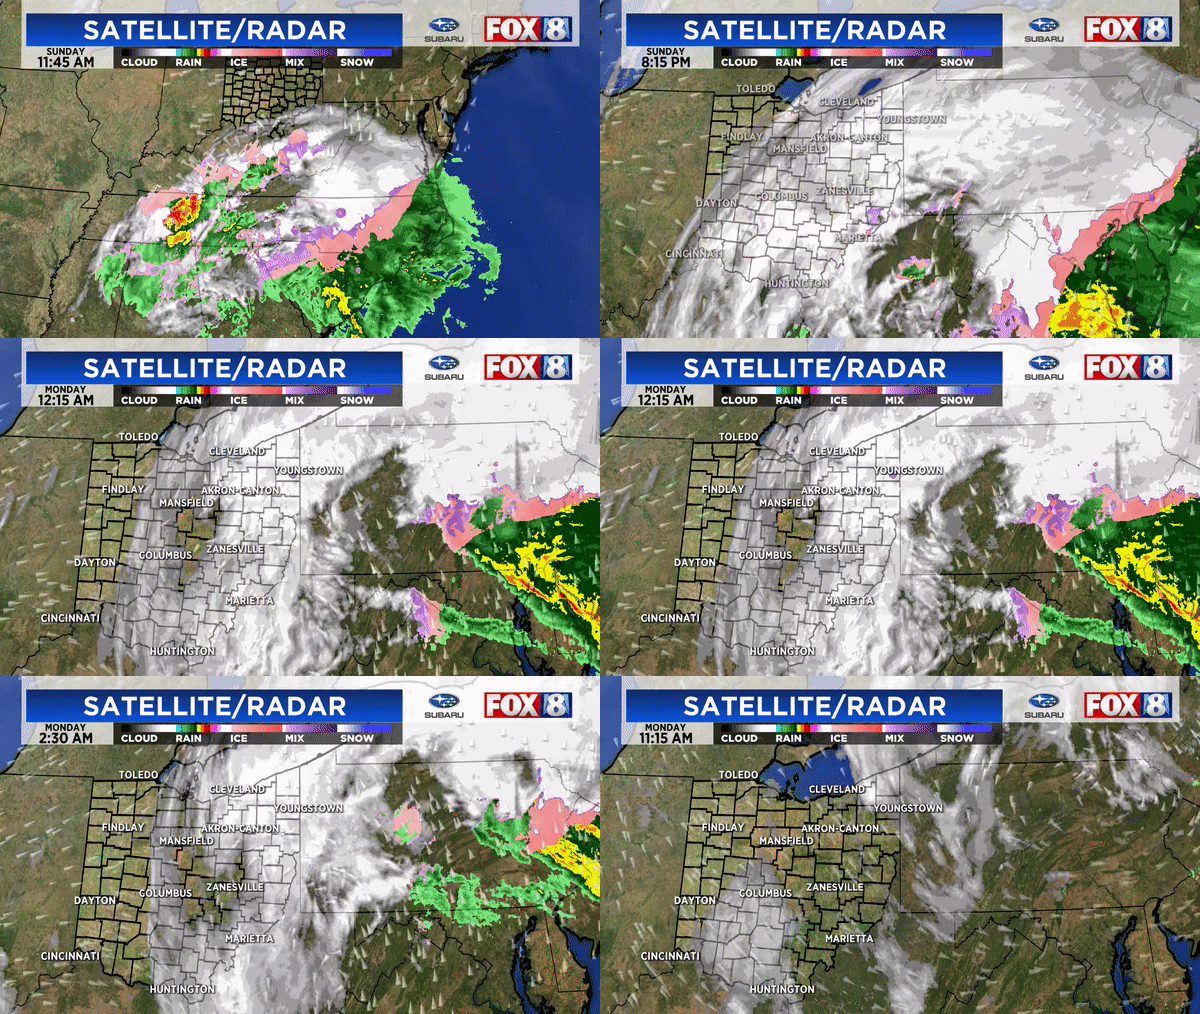
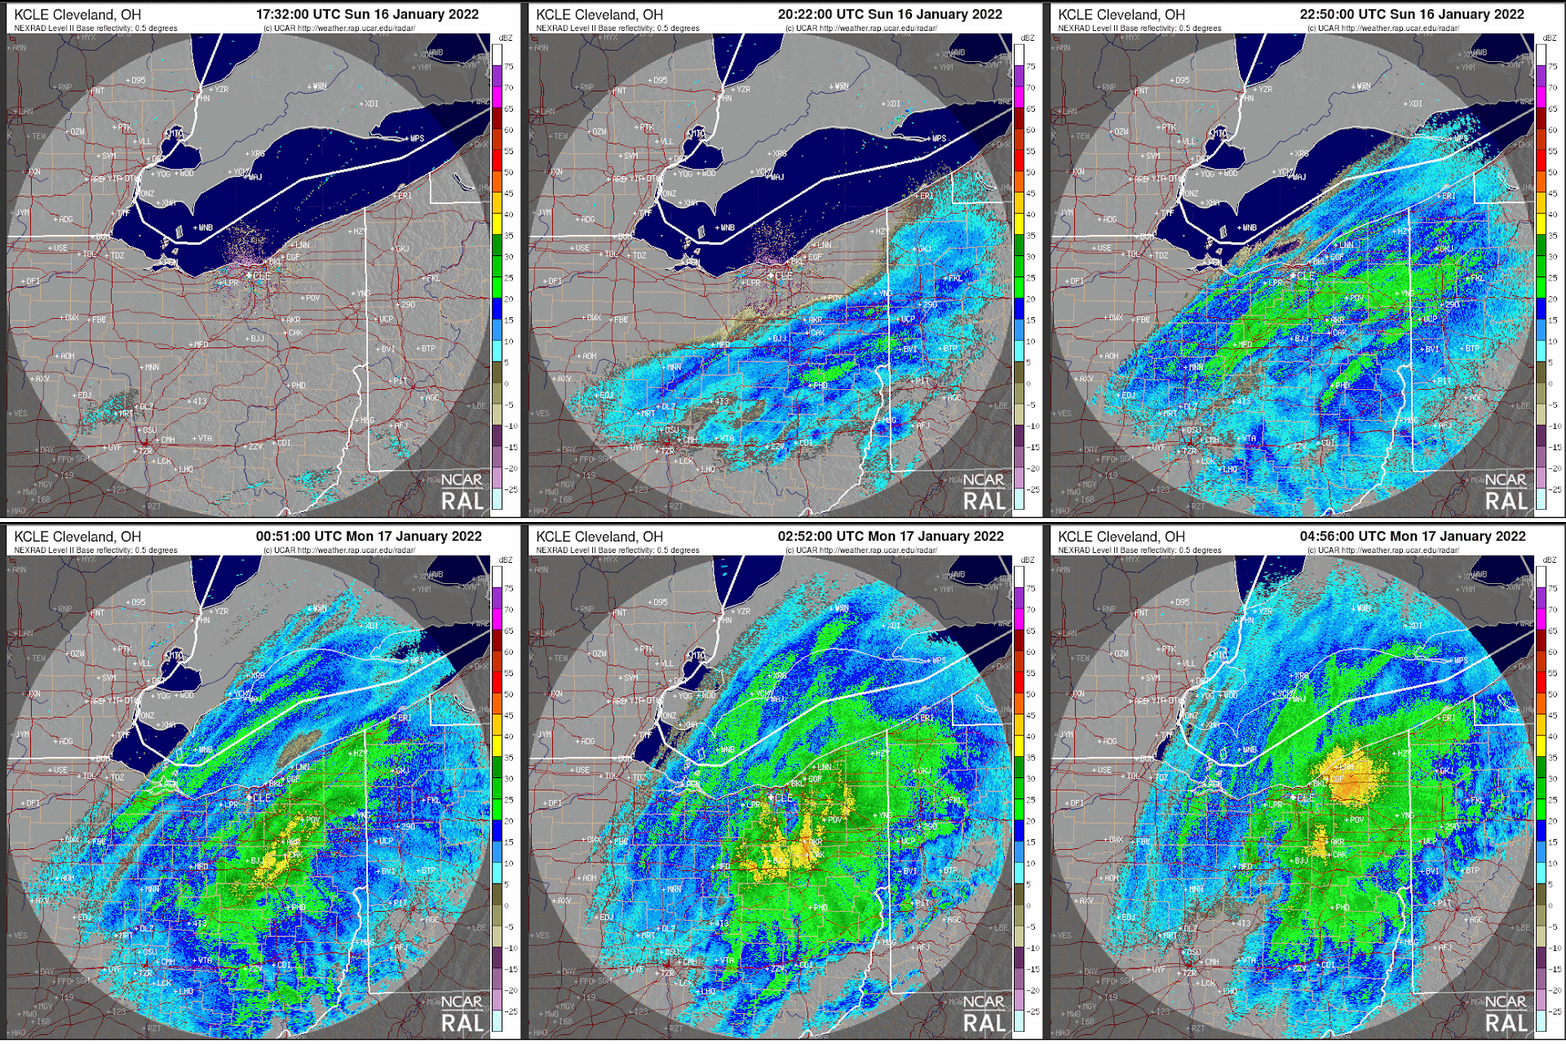
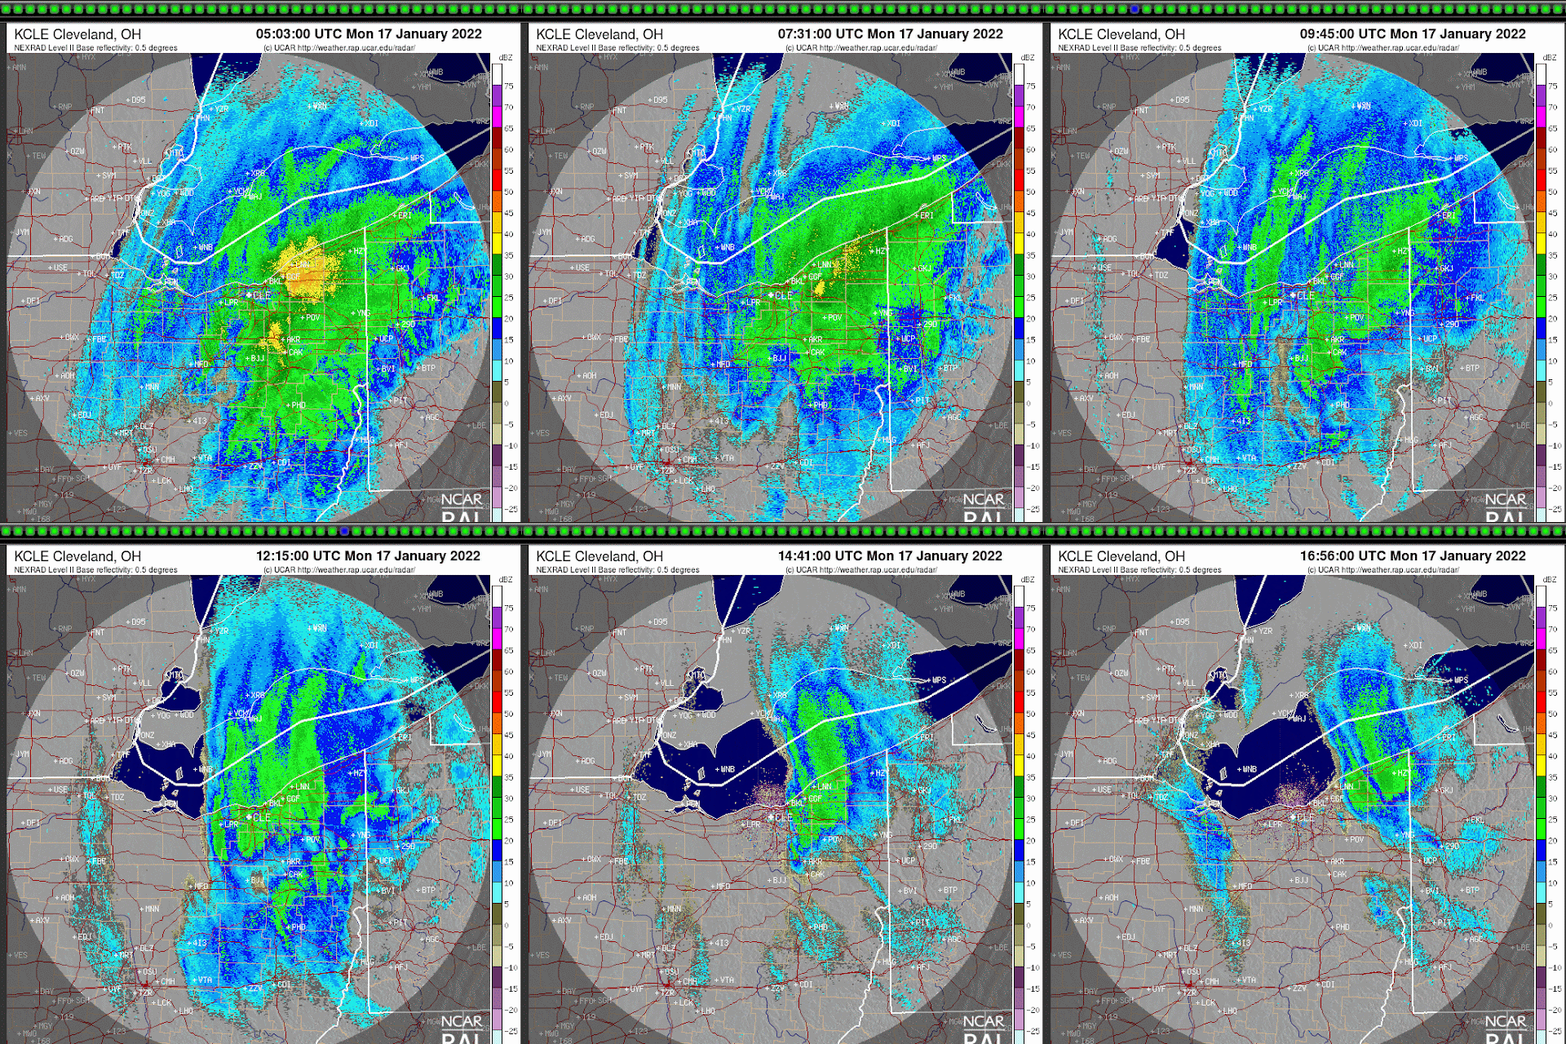
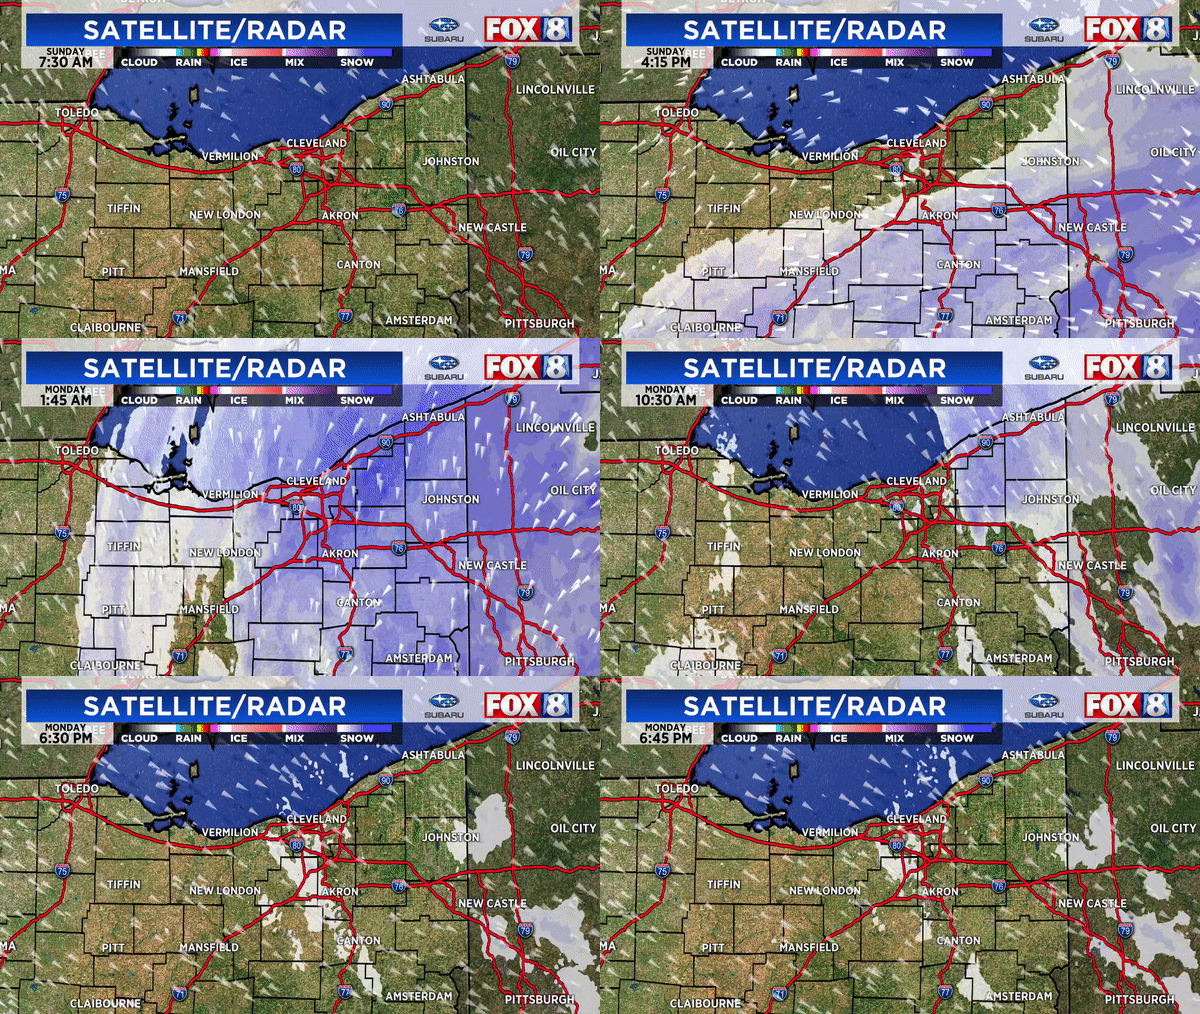
The result was this radar trend between Sunday afternoon and midday Monday.
Base reflectivity radar loop from late Sunday afternoon to midnight Monday January 17
Base reflectivity radar loop from midnight to noon Monday January 17
Composite local radar from early Sunday through Monday afternoon:
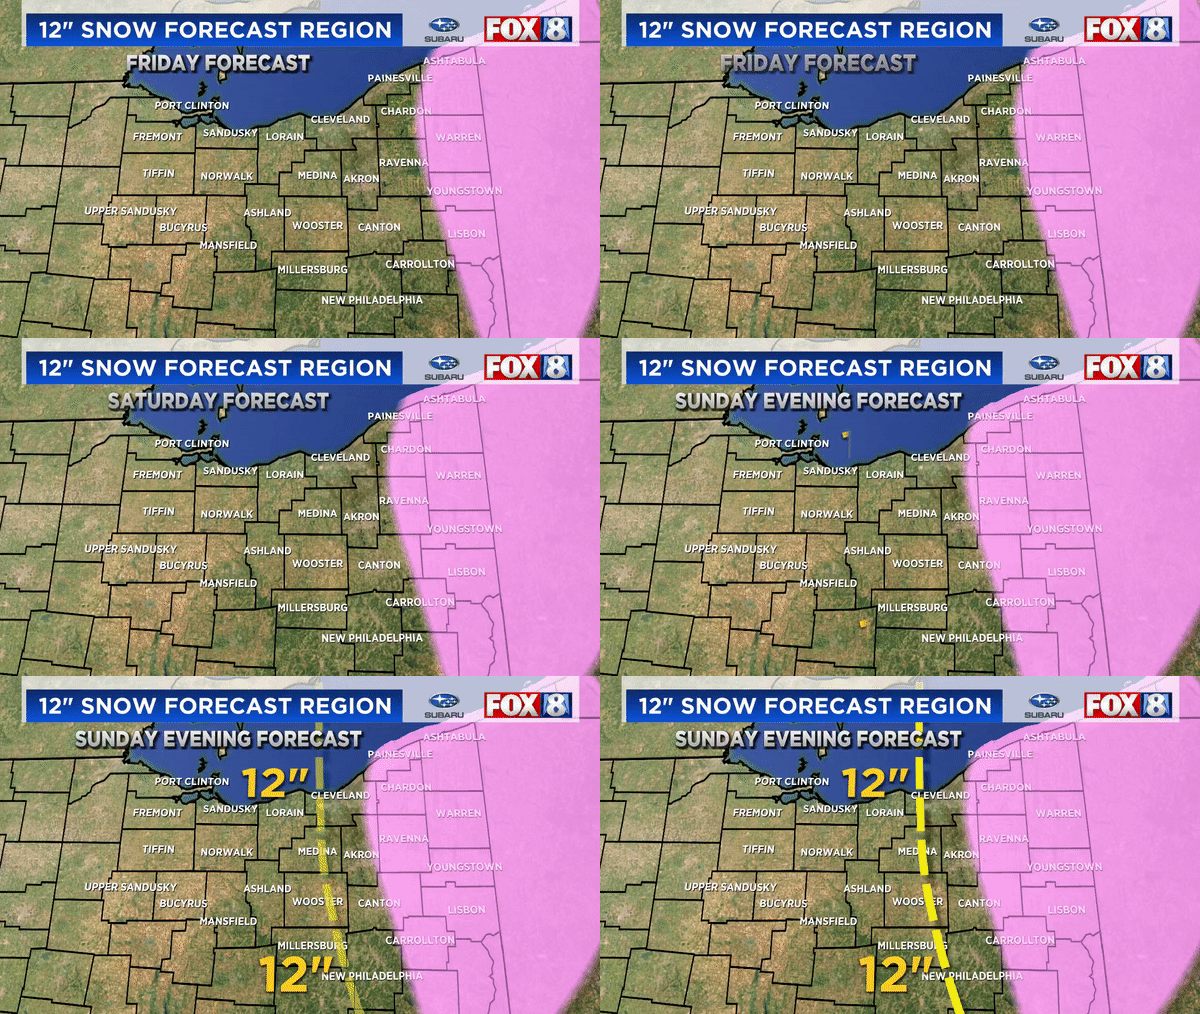
Again, our 12 inch snowfall forecast cut-off was shifted west slowly each day. The actual 12" amounts verified west by about 20 miles west of our final forecast
Overall snowfall totals from Friday through Monday. (some numbers might be too low as this is a compiled map from previous reports)
After every big weather event, its easy to Monday morning quarterback snowfall forecasts. I do it too. After forecast snow events for more than 25 years, I've seen computer models blow up snowfall amounts (once more than 35" across half of the state) only to back off at the last minute. I've been burned when trusting models verbatim many times. So here are some pointers for everyone and future forecasters:
* Models are only ONE forecasting tool not Gospel. Don't use model trends verbatim.
* Weather forecasting has and will always have a human element
* Using a blend of models or a trend model forecast doesn't mean the forecast will be more accurate
* Use history as a guide but not the only guide
* Take into account how the public will perceive your forecast knowing you'll need to augment it
How about some common questions and comments:
QUESTION: "So why didn't up the snowfall forecast to reflect the changes in the models?"
ANSWER: As said earlier, forecasts are not made solely by model output. Should more adjustments have been made toward high amounts further west? In retrospect perhaps. Some changes were made Sunday evening. Remember that this rarely happens here. SEE MY POST HERE
STATEMENT: "Models predict snowfall. Models predict rainfall. This seems easy."
RESPONSE: Hardly. Models don't forecast snowfall specifically, they forecast liquid precipitation then translate it to snowfall using a ratio (often times 10 to 1 but not always). All snow events are not a continuous 10:1 or ratio. The ratio changes over time. The trick is determining what the ratio is and how long/intense the snow.
COMMENT: "We weren't under a winter weather advisory on Saturday yet we got 5-10" of snow Monday. We weren't prepared for this!"
RESPONSE: I disagree. The seeds of this stormy pattern were showing up around Christmas. We started mentioning the high potential for snowfall 5-6 days before the event. Initial snowfall forecasts were made early Saturday. Adjustments were made Sunday morning as advisories then warnings were issued for western counties"
COMMENT: "I had 5 inches of snow in my backyard yet my county was under a warning. Wasn't that overkill?"
RESPONSE: Back on Friday we mentioned that their would be a sharp cutoff west to east between super heavy snow and less amounts due to the position of the storm. Eastern half of many counties received 12"+ while the western parts received half of these numbers. Advisories and warnings are issued on a county basis knowing that local snowfall amounts will vary over short distances.
REMEMBER: Weather doesn't stop for county lines.
COMMENT: "I saw the storm strengthening in Virginia. You should have predicted more snow."
RESPONSE: "Strengthening storm systems hundreds of miles away DOES NOT necessarily translate to more snow in northern Ohio"
QUESTION: "What have you learned from this snowstorm?"
RESPONSE: "Great question. I am studying all aspects of the storm and the conditions that were present in an effort to better forecast the next one. I've also realized that people will react to snowfall forecasts differently depending on how they experience the snow (psychology and perceptions). As communicators of weather information especially snow, we're damned if you do; damned if you don't."
"Snowfall forecasting especially with major snow storms are multifaceted and highly nuanced and never made in a vacuum. Adjustments were made by ALL meteorologist both on TV and within the National Weather Service as the situation developed. If we would have posted 16-25" initially people would have said we were crying wolf if it didn't work out. I've seen it a hundred times."
I've written variations of this post many times over the last 5 or so years and it bears repeating. I rarely post snowfall maps/computer model projections further out than 2-3 days on social media platforms. Why? Look at these long range computer model projections starting Monday--4 days prior--for the snow event Friday and Saturday, January 12 and 13th.
Sunday Evening 1/7 (Model #1. I forgot to save Model #2 for comparison)
Monday Morning 1/8 (Model #1 vs #2)
Monday Evening 1/8 7PM (Model #1 vs #2)
Tuesday Evening 1/9 7PM (Model #1 vs #2)
Wednesday Evening 1/10 7PM (Model #1 vs #2)
Look at the HUGE difference between each model.
Many people posted these images online and even showed them on the air. In most instances these were shown to convey the fact that we had a long way to go before an official forecast could be made with a high degree of certainty. Uncertainty was being conveyed. It has the best of intentions. I get it. I've done it. Makes sense, right?
Except in the real world, most humans rarely interpret this type of information--data--through a rational filter. Data makes us feel conflicted. We, whether we like it or not, overly simplify complex ideas. Computer model projections are a prime example. That's how we're wired. It's well documented with behavioral scientists.
We look at the numbers, pick one out--say 20" of snowfall--react impulsively to it without historical perspective (by the way that's never happened in 24 hours from a general snow event since record keeping began) or context and before you know it, hysteria ensues. We see it on social media every time. Unfortunately social media reactions spread at an exponential rate devolving as the comment thread lengthens. Before you know it, the benign, educational intent of the snowfall uncertainty post is lost. It involuntarily morphs into a totally different story that spreads like wildfire changing with every re tweet and re post. The old game where you sit in a circle an say a sentence to the person to your right and that person to their right applies here. When the message comes back around to the beginning, it's changed entirely. Do you see the problem?
All of us meteorologists here at WJW FOX 8 always choose to wait until we have a high degree of certainty before we post any snowfall numbers usually in some sort of range. The aim is to eliminate what I just described in the paragraph above. This was my post Thursday morning, roughly 36 hours before the event begins. (Note: Andre Bernier, our evening meteorologist had a more basic snowfall map the night before not shown here)
How do we combat our hard wired human nature? The answer is simple: We don't. WE QUALITY CONTROL OUR INFORMATION!
Psychology plays a huge role in weather forecasts. As a meteorologist who reaches hundreds of thousands of people each morning on the top rated morning show in Cleveland, Ohio, I owe it to each viewer to quality control what I say and what I create visually to accompany it. The psychological element--how the viewer perceives what we say--is a critical weather cast element that is often overlooked by on air meteorologists. The words/numbers that we say/post on the air and online can be more powerful than the weather itself. In this age of posts solely created for clicks with the hopes of a long, viral lifespan, quality is too often sacrificed. That's fine for a cute picture or a clever, humorous meme but when a major weather event is eminent over a large population area, high quality information created for the masses is of the utmost importance.
Recently the National Weather Service has implemented a program in the works for several years that streamlines their winter season watches, advisories and warnings in an effort to simplify the forecast message for the general public. The great folks at the NWS Office in Cleveland recently hosted a seminar for media personnel highlighting these changes. The information was invaluable.
As meteorologist we always need to remember the psychology behind what we do. As communicators of science (data) need to put ourselves in the minds of the public and ask: "How is the viewer going to interpret what I say?" So when I create a snowfall forecast range map, I take into account how people react to EACH WORD knowing that many will perceive these range to fit their location.
We must remember:
* Public perception is very powerful
* We need to be better communicators of information
* Choice of words is of the utmost importance in conveying severity of the weather
* Mass media is for the masses. Risk is personal to the public. Yet people want personal forecasts. Huge conundrum.
* Human beings dislike uncertainty.
* Too much emphasis on uncertainty breeds confusion, inaction and ultimately apathy when the next snow or weather event of importance happens. Basic psychology here. We need to find a delicate balance between voicing uncertainty and sticking to a forecast geared to the general public without causing social media unrest
There is little sign that this cold April will end anytime soon. The cold air this weekend will be similar to last weekend. In fact, the 850mB (5000 ft) temps over Lake Erie, the key component for determining lake effect snow amounts, might crack the top 5 coldest ever for the month of April since 1950! Here is the list per the NWS
Both the GFS and the European show pretty much the same amount of cold as of this writing.
The pattern shows some signs of moderation across the eastern US but not until at least the midway point of the month. Another wave of colder air will follow this weekend's cold by the middle of next week.
The lack of snowfall this winter is almost historic. So far, our season snow total is the lowest since the winter of 1931-32.
April snowfall of at least one inch happens roughly 50% of the time. Here is a look at the percentage of seasonal snowfall in April. This past weekend's snowfall brings this year's percentage up to 5%. Expect snow chances to climb with each burst of colder air through the middle of the month.