Showing posts with label summer 2016. Show all posts

Friday, August 12, 2016

What Are Shelf Clouds?

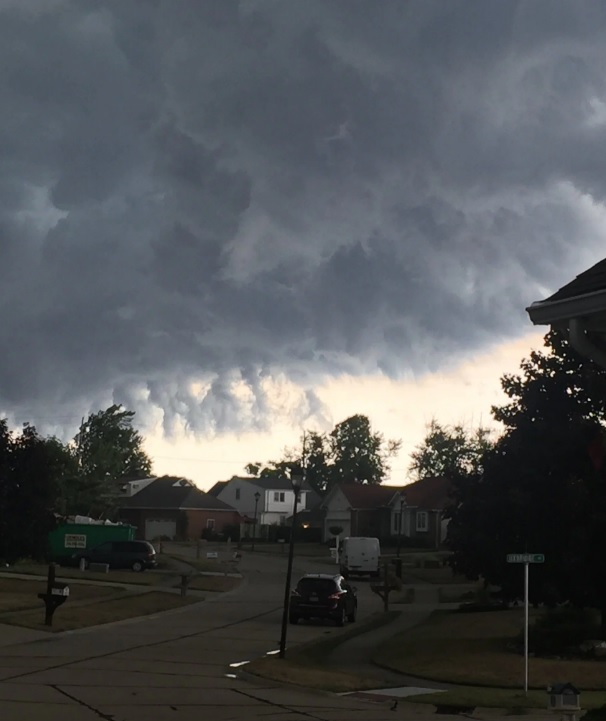
Thursday, August 11, 2016 several strong thunderstorms passed over the Cleveland suburbs. Many viewers submitted photos of stranger cloud formations with some speculating that there tornadoes. What are these clouds?  Are they a rare phenomena?  Not really. These are called shelf clouds or Arcus Clouds. They are fairly common around thunderstorms even in northern Ohio. I blogged about shelf clouds over 10 years ago!


What are shelf clouds? The National Weather Service has a great description.
Shelf clouds are typically seen at the leading edge of a thunderstorm or squall line of thunderstorms. Remember, shelf clouds are not tornadoes or wall clouds. These are formed when rain-chilled air descends in a thunderstorm's downdraft, then spreads laterally when reaching Earth's surface. Warmer, more moist air is lifted at the leading edge, or gust front, of this rain-cooled air. When this warm, moist air condenses, you see the shelf cloud. 
Normally, you will feel a burst of cooler wind followed by rain and maybe hail. The higher gusts occur on the back edge which can cause downed trees and power outages. So when the next storm develops, look for the Arcus Cloud. Remember that tornadoes normally don't accompany these cloud formations just gusty winds, rain/hail then the highest winds toward the back end.


Monday, August 01, 2016

A Brief History of Drought in Northeastern Ohio


Since June 1st, we continue to accumulate a rainfall deficit across northern Ohio and many parts of New England. The overall pattern has featured storm clusters to travel northwest to southeast through the corn belt.  Yet much of northern Ohio, parts of Michigan and New England has missed out on frequent rainfall this summer.


As with many meteorological events, people on social media are comparing this dry period to other droughts of the past. For me, the big droughts of 1988, 1991 and 2002 come to mind. 1988 always appears on the top of my list because of the intense heat that summer. I didn't mow a lawn for 3 months!

Is there a way of comparing past periods of drought accurately? The Palmer Drought Severity Index is a great tool in comparing historical periods of above or below normal dryness or wetness of an area.

Per NOAA: "Palmer Drought Severity Index: attempts to measure the duration and intensity of the long-term drought...long-term drought is cumulative, so the intensity of drought during the current month is dependent on the current weather patterns plus the cumulative patterns of previous months".


Ohio has 10 climate divisions. I downloaded the historical PDSI monthly numbers for the northeastern Ohio climate division #3 and plotted them in roughly 30 year time periods. Green indicates wetter than normal, yellow shows drier than normal. THE SCALE ON THE LEFT CHANGES ON EACH GRAPH SO BE CAREFUL IN YOUR COMPARISONS

A few things to note based on these observations:

*  July 2016 PDSI is probably closer to -3.5. Montly numbers are not available as of this writing.

*  The 1991-92 drought was longer and more severe than any drought since the mid 1960s even beating the hot summer of 1998!

*  Frequency of wet periods were much higher than dry periods since 2000

*  The drought of 1962 to 1966 is comparable in duration to the drought of the early 1930s. These           drought events mark the only two instances where the PDSI dropped below -6

*  Many periods of drought from the 1910s to the 1930s with very little long term recovery

*  Three major droughts between 1895 and 1910


These graphs are great but they are annual monthly plots.  How about summer droughts? I singled out the summers (May through September) where PDSI levels stayed below -1. (NOTE: I CHANGED THE SIGN OF THE PDSI NUMBERS TO POSITIVE TO BETTER REFLECT THEIR SIGNIFICANCE GRAPHICALLY)

Some years to note:

* The summer droughts of 1991 and 1999 started off earlier and lasted into September. 1988 was tame in comparison.

*  During the summers between 1930 to 1934, fifteen of the twenty-five months had drought levels below -3.  During the 1960s' summer droughts, only six of those twenty months saw levels that dry.

* Yes, our soil moisture is significantly dry. But we have a long way to go before this drought becomes historic




Thursday, April 28, 2016

The BIG Winter Recap - Part II - Northern Ohio (Summer Thoughts)

The last "cold" morning in Ashtabula this winter
The strongest El Nino since 1997-98 and a stable arctic tempered the cold of the last two winters. Temperatures across northern Ohio were well above normal with below normal snowfall similar to the winters of 2011-12, 2001-02, 1997-98 and 1982-83. Two of those three were strong El Nino winters.  Our outlook last fall was for above normal temperatures and slightly below normal snowfall.


Above normal temperatures were more extensive across the US. According to the NCDC, global ocean temperatures were at record levels.  (See PART I of my winter recap for other drivers)


Given the panhandle storm track forecast back in September/October, we were very confident that we would get hit with at least ONE big general snowfall which would boost snow totals into the 50-55 inch range. Overall, the heavy snowfalls stayed south and east of northern Ohio which kept our totals even lower. Those big snows came VERY close to northern Ohio!

BIG SNOW ACROSS SOUTHERN OHIO...VERY CLOSE TO CLEVELAND & AKRON

How does this winter compare to the last two cold winters? How does this compare to the similar winter of 2011-12?  Here are the final tallies.  The same metrics used in last winter's winter recap were used this year to keep everything consistent.


Everyone thought winter was over until our early April snowfall. The April snowfall was almost 24% of the entire winter total; second highest ever!


 Lake Erie Ice Cover reached a peak of 75% for a few days in mid February.


 That's a bit misleading as the peak ice cover went from 3% to 79% in 3 days! In 11 days, it dropped to ZERO in a week and a half.  GRAPH BELOW

Ice cover was thicker and more widespread for much longer last winter.  For comparison, last year it took 28 days to reach 94% and it stayed above 90% for 47 days. Whereas in the winter of 2011-12 (similar to this winter--see above), ice cover reached 13%, only 6 days above 10%.  


Ice cover during the last big El Nino back in 1997-98 was even LOWER than this year. A whopping 8.4% maximum!


Will the leftover winter El Nino play a role in our summer temperatures and precipitation?  Will El Nino continue to weaken?  If so, how will this effect the summer and upcoming autumn? Will severe weather occur more frequently?  Summer Outlook coming up in a few days!  Check out fox8.com 


Sunday, April 17, 2016

Lake Erie Water Temp vs 1998


The water temperature is still at dangerously cold levels. The lake water temperature lags behind the land temperatures a good 60-80 days in spring. Daytime temperatures in the suburbs can reach mid 60s or 70s yet the lake will stay very cold.  Water temperatures usually don't rise into the 60s until early June. Please, be very careful around the lake over the next two months.

We just came off of a big El Nino winter.  Milder temperatures with below normal snowfall. (we can very close to getting dumped on several times with large snowfalls. Those storms headed into New England). Will the lake water temperatures mirror the spring/summer of 1998, the end of the last big El Nino winter?

This graph show the water temperature in mid April as of this writing on the left.  The right box shows all of the Great Lakes during 1998 (after the last major El Nino).


The water temperature is already slightly above the 25 year average and in line with the April 1998 levels. Assuming we don't have significant runoff from heavy rainfall this spring through mid June along with average to slightly above normal temperatures, water temperatures should stay slightly above normal this summer if your heading to Edgewater or Cedar Point!

Here are the Lake Erie water temperatures in spring of 1998 with 30 year average in parentheses:

May 1:    52  (47)
May 15:  54  (52)
June 1:    64  (57)
June 15:  67  (62)
July 1:     71  (68)
July 15:   77  (72)(
July 21-23:  79 (Highest)  (73 on the 22nd)
August 1:    77  (74)
August 15:   77  (74)
September 1:   77  (73)
September 15:   73 (71)
September 30:   71  (67)