Tuesday, July 05, 2022

Are Summers Becoming More Consistently Humid/Less Breaks?


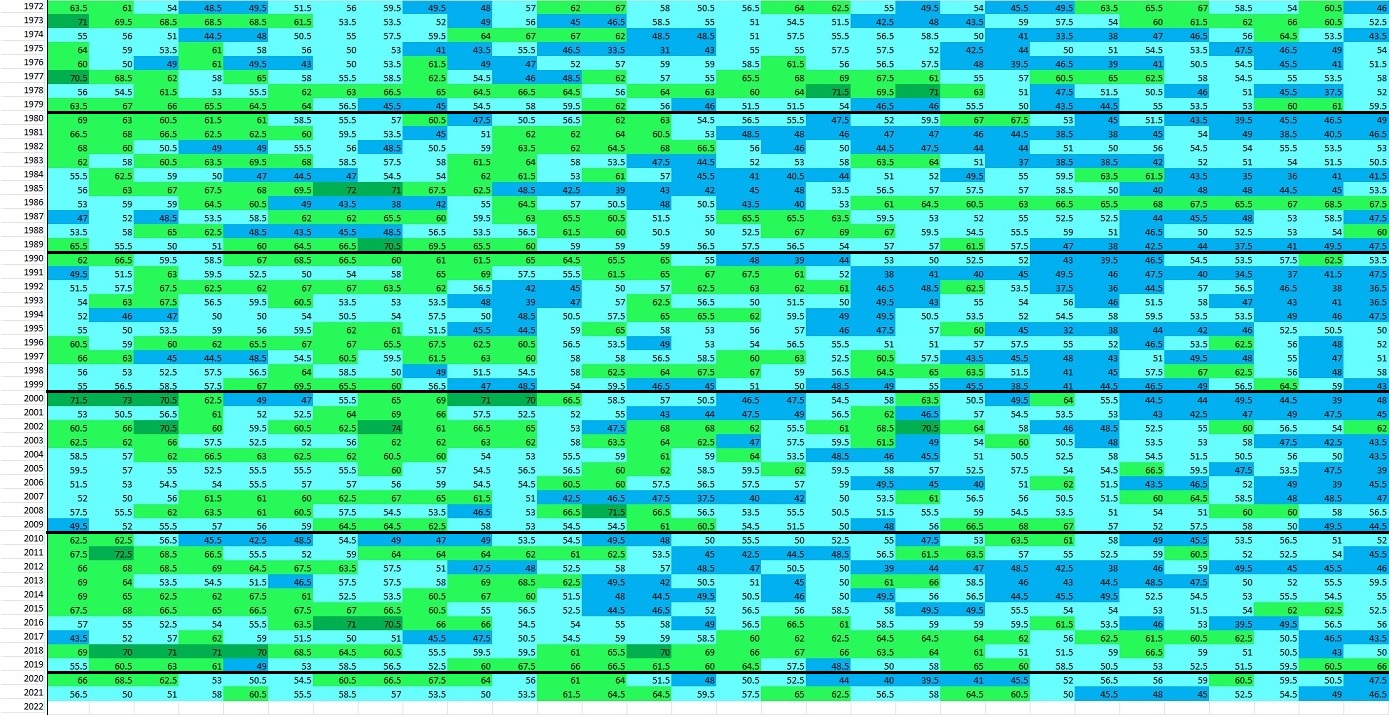
The plots below are the average dew point for each day from June 1 to September 30 since 1972 for Cleveland. I color coded each dew point range for easy reference.

Dark Blue: 30-49°

Light Blue:  50-59°

Light Green:  60-69°

Dark Green:  70-80°

First image is the month of June. Reading left to right for day one through 30. Horizontal black line separates each decade. I notice more breaks from high humidity days in the 1970s and 1980s. More consistently high humidity in the mid/late 1990s into the early 2000s. Recently, lower humidity days seem more frequent in the first half of the month


Second image is July. Over the last 10-15 years the frequency of "lower humidity" days (light blue) seems less than previous decades.


Third image is August


Fourth image is September:


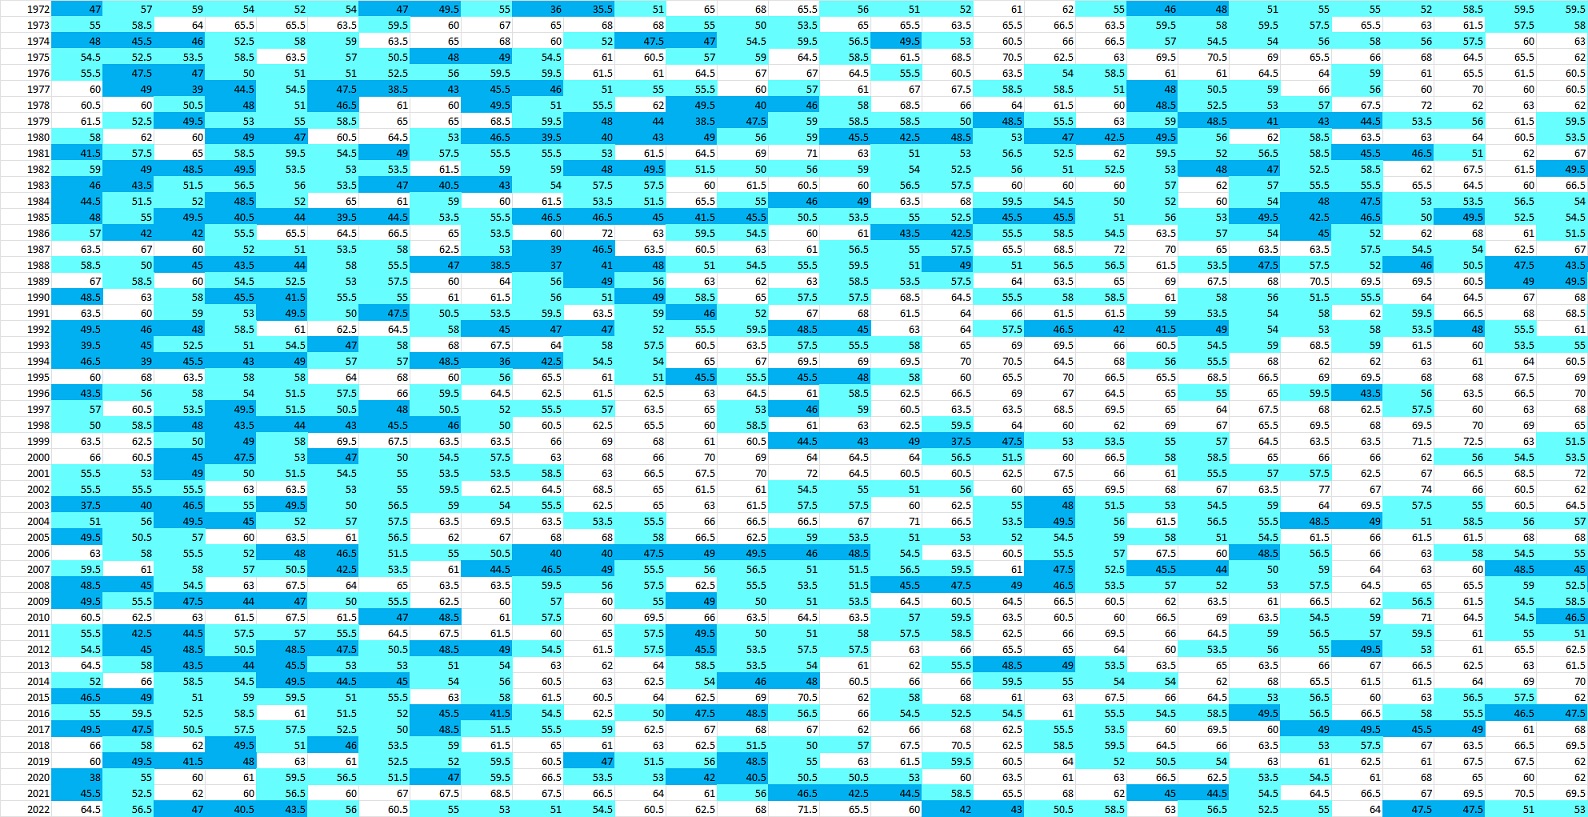
Let's only display the days with dewpoints UNDER 60.  Basically more comfortable days. Now we can see the frequency of delightful days for each summer month/day.  Some quick observations:

* Breaks in the humid days in June look to be more frequent in the 1970s/80s and early 2000s
* Breaks in humid days in July more frequent in the 1970s, early 80s and early 2000s.
* Breaks in humid days in August more frequent in the 1970s.
* Breaks in humid days in early September more frequent in 1970s and 1980s

JUNE DEWPOINTS SINCE 1972 (UNDER 60)


JULY DEWPOINTS SINCE 1972 (UNDER 60)


AUGUST DEWPOINTS SINCE 1972 (UNDER 60)


SEPTEMBER DEWPOINTS SINCE 1972 (UNDER 60)

Friday, June 24, 2022

Tornado Warnings - NWS Cleveland - Date of First Issuance


Friday, June 17, 2022

What's Different Between 2021 Jose Ramirez and 2022 Jose Ramirez?


Jose Ramirez is on a torrid pace. He leads the league with 62 RBI.  He's second in slugging percentage at 0.649. Looking at more advanced statistics, the story remains the same. His 0.437 wOBA is good for 4th in MLB.  His wRC+ of 193 ranks 5th. 

What stands out among the top hitters in run creation is their strikeout rate. The average rate of the players below (minus Ramirez) is 19.8%.  Jose Ramirez strikeout rate is... 7.4%. 

We've seen Jose Ramirez put up great numbers in the past. What is different about this season vs last season and others?  Let's examine contact.

Jose has always been a good contact hitter. His contact percentage across the entire strike zone has been between 86-90% over his career. The increase this year is 3% versus last season. What's more noticeable is his productivity increase.

His in-zone contact is virtually identical to last year. Not much change.

Look at his out-of-zone contact. A 10% jump compared to 2021!

He's making more contact at pitches out of the strike zone!  Contact is one thing.  How productive is his contact out of the zone? 

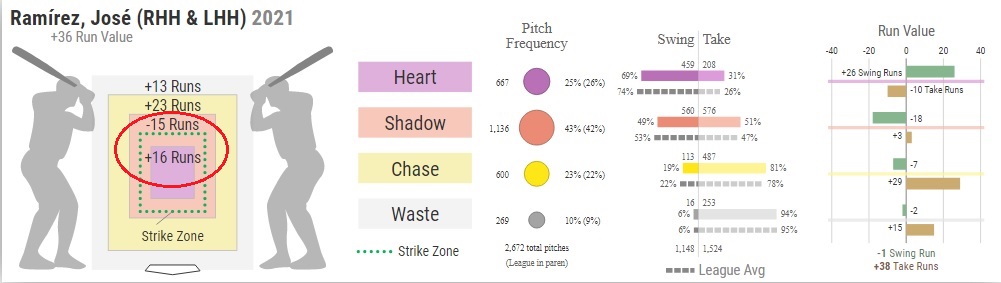
This graphic comes from Baseball Savant. We can assign run values to the strike zone based on each base state during a typical game. Here's a detailed explanation.

Take some time to familiarize yourself with the graphic. There are four regions:  HEART, SHADOW, CHASE, WASTE.  The total number of runs for each region is indicated on the left.  For example in 2021, Jose Ramirez's center of the zone total runs was +16.  Yet his shadow zone was -15 runs.  He was near league average in swings in the shadow zone, his productivity in runs was negative!


Compare last year to this season through June 16.


His shadow zone so far this season: +5 runs vs last year which was -15 runs.  

So far this season Jose Ramirez is 5th in MLB in runs in the shadow area. In 2021 he was 188th!

Basically, he's being more aggressive with more swings at pitches in the outer part of the strike zone and in the area just outside the zone.


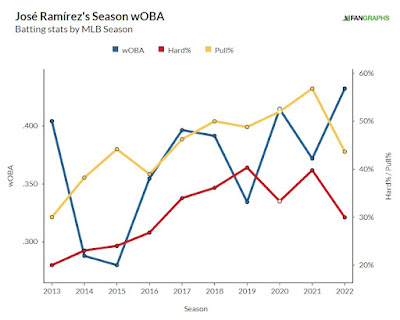
Interestingly he is not hitting the ball as hard as last season.  Roughly a 10% drop in hard hit balls. This hasn't impacted his productivity as his overall wOBA is higher than in any previous season through mid June.  One reason for the reduction in hard hit balls is that he is hitting the ball more up the middle and pulling the ball less.
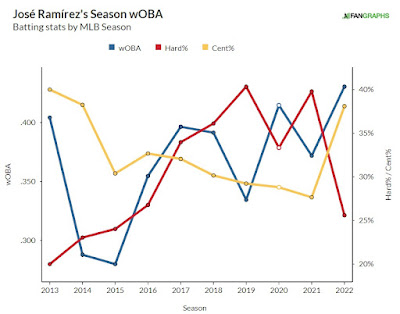
wOBA  Hard Hit%  Center Hit%

wOBA   Hard Hit%   Pull%


Has he made changes in his approach in different counts?

Here are his slugging percentage for each count over the last 5 seasons (not counting 2020).  His slugging is lightyears ahead of last season on the first pitch. 


The changes year-to-year sum it up: He's made significant improvements when ahead in the count especially at 1-0, 2-0, 3-0 and 3-1.  Also, his slugging jumped from 0.493 to 0.613 after the 7 inning!


Sure his production with the bases empty is in line with last year.  However he is productive when it counts. 
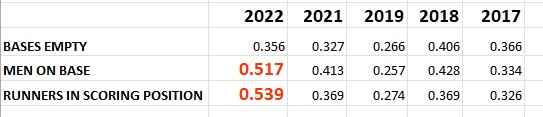
wOBA with runners on base/empty

Let's see if these trends continue.


Monday, June 06, 2022

How Humid was Last Summer? A Look At This Summer


Last August I wrote about the summer humidity at that point in the summer (You can read about it HERE). So I figured I'd revisit the topic now with last summer's final ranking.

It turns out that SUMMER 2021 was the 4th most humid summer since 1948 followed by 2010 at #3, 2018 at #2.  What summer is #1?  1995


Was last summer (2021) ranked #4 because we had an abnormally high number of days with dewpoints in the 70s?  Probably not. The next graphic shows the number of hours for each year we reached a dewpoint of 70+.  

There were 21 other years with more than 2021!  So what was special about the humidity last summer?  It was consistently humid with very little breaks.  

The number of hours with a dewpoint BELOW a dewpoint of 60 really tells the story.  Only 5 years had fewer hours with dewpoints under 60!  1973, 1987, 1995, 2010 & 2018.   Basically last summer we had far fewer breaks.


Our summer outlook for 2022 highlighted a slow start to summer.  So far as of this writing (June 6) the number of hours with dewpoints above 70 is ZERO!  


Last summer at the end of June we had 71 total hours so we have a long way to go to catch up to last year.  Remember it's early


Friday, May 06, 2022

Rainfall 2021 vs 2002: April 1 to May 5

Rainfall this spring has overall been above normal.  Using NOAA MRMS radar data from the Iowa Mesonet Site here is a county by county breakdown of total rainfall over this 35 day period comparing this year to last year

Legend for each graphic below (2" to 7")

Mansfield, Ashland, Wayne, Holmes Counties


Lake, Ashtabula Counties

Cuyahoga County

Erie County

Geauga County

Huron County

Lorain, Medina Counties

Summit, Portage Counties

Stark County

Tuscarawas County


Wednesday, April 20, 2022

50 Cognitive Biases - These Influence How You View The Weather!

Over the last decade or so I've written about cognitive bias in how it shapes the way we view weather conditions and the weather forecast HERE, HERE, HEREHERE and HERE.  Here is a comprehensive list of biases from Visual Capitalist. How do these influence your thinking?


Tuesday, April 19, 2022

Snow to 80s in April. How Often Does This Happen?

Snow showers this morning. Yes, it's April 19th

Hinckley

Twinsburg


April snow is not that uncommon. Look at the snow history from Late March through April. These are the individual instances of snow for EACH DAY since April 3rd color coded. 


Yet this week temperatures will be jumping significantly heading into the weekend. (SOI forecast from April 5th seems to be working out). 

SOI Changes in early April connect with these historical weather conditions


All of this means we could go from accumulating snow to 80 in a little over 4 days. When was the last time this happened?  LAST YEAR

I was surprised to find this has happened almost 60 times since 1950! The fastest SNOW to 80s was 19 hours in April 3-4, 2007

How about 80s to snow?  Only 10 times. Most recently in 2018


Big temp swings in March and April occur with high frequency vs other months. These big changes occur in the central US more than in the Great Lakes.