Wednesday, July 05, 2023

July 3rd Warmest on Record GLOBLLY. Here is the Breakdown

According to NCEP (National Center for Environmental Prediction), July 3rd was the warmest day on record GLOBALLY.  Note this is not for one city, one state, one region or one country.  It's the entire planet. 

Global Temperatures vs Normal 18z July 3rd

The average global temperature reached 17.01 degrees Celsius (62.62 Fahrenheit), surpassing the August 2016 record of 16.92C (62.46F).   

The largest warmer anomalies are located near Antarctica.

I broke down the globe into 9 different locations. The break down is done to show how the temperature anomalies vary within each region. Each image shows the locations with above normal (warmer colors) temperatures and below normal (cooler colors) temperatures on July 3rd.  The global average takes into account ALL of these regions below.

First North America. I labeled regions that are above normal with "AN" and below normal with "BN"


Now the lower 48 states:


The Caribbean and Mexico:


Canada:


South America:


Europe:


Asia:


Middle East:


Africa:


Australia:


Monday, June 19, 2023

Tornado Recap

For the first time since early September last year, northern Ohio saw it's first tornado warnings June 15.  Not the latest on record but close. 

Latest first tornado warning in order (after June 1st):

July 24, 2005

June 24, 1999

June 22, 1990

June 19, 2021

June 15, 2023

June 5, 2016

June 3, 1989

June 1, 1987

Not every tornado warning means there were actual touchdowns.  In most instances (75% of the time approximately) the warning is issued due to doppler radar indicated rotation within the storm.  Last Thursday, not only did we have multiple tornado warnings, we had multiple tornadoes!  Here is the list: (h/t Mackenzie Bart and Dontae Jones for the graphic)


NWS statement here

Red dots indicate the approximate location of each tornado


Here is a nice video of a constructed powerpoint of the entire severe storm event via the Iowa State University - Mesonet Site (IEM Raccoon).  88 slides total. 5 seconds per slide. Well worth it.

Video format from youtube


Friday, June 02, 2023

Little Humidity. Little Rainfall. The Complete May 2023 Recap


Lots of colorful  👇   charts here so be prepared!  

We were coming off of an extremely wet April. Temperatures were slightly above normal.  7 of the last 10 days had measurable rainfall.  Back in late April the changes in the tropical Pacific (SOI drop), northern Atlantic (negative NAO) and Bering Sea Low pressure were strongly pointing to a cooler than normal start to May.


Early May Outlook posted back on April 21

The upper level pattern in 7 day increments:  500mB (18,000 feet on left)  Jet stream on the right featured an active west-to-east storm track left over from late April.
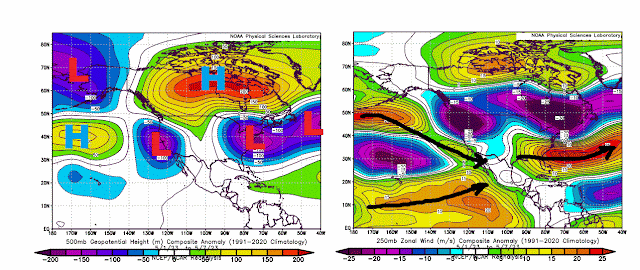
May 1 to May 7

By the second week of April, the ridge over central Canada shifts west and south.

May 8 to May 14

Notice the split flow which emerged in the middle of the month. Storm track along the southern border and west to east through central Canada and into New England.
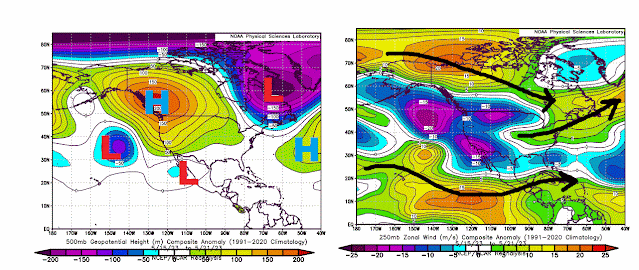
May 15 to May 21

By the final week of May, two pronounced jet stream tracks kept storm systems away from the central keeping the mid-west and corn belt very dry.

Overall temperatures west of the Mississippi and in the upper mid-west were above normal.


The center of the heat was in western Canada.


The split flow kept a large portion of the central US, deep south and Great Lakes extremely dry.


In northern Ohio, we had rain to start the month which skewed the overall totals. 25 of the 31 days were dry.


Temperatures in northern Ohio were slightly below average.  We had more days below than above.  Days in grey were a degree to either side of average.


By far the biggest element was the lack of humidity.  


In fact, April had more humid periods than May. 


We average more than 105 total hours of high humidity in May.  We ONLY had ONE HOUR!  Only 1966, 67, 68 and 1971 compare.


April and May high humidity periods (total hours) compared to past years.


The average northern Ohio humidity in May was the 3rd lowest since the last 1940s.


Severe storm warnings were non-existent in Ohio and surrounding states compared to April.


What about June?  On May 22nd, the tropical Pacific indicated a HUGE drop in the SOI.  Using the historical analogs, the "less humid & dry" pattern looks to continue through the middle of the month.  The projections on June 2 were latching onto this idea bigtime.


What we will watch during the second half of June/early July is how much the severe dry conditions will persist.  If they do, the dry ground could feed the central US ridge further enhancing the heat. More on this in the weeks ahead.


Friday, May 12, 2023

How Does The Weak Cleveland Guardians Offense Compare to Past Years?


How does this year's offense rank?  How does it compare to each season since 2015 through May 10th?


The fact that they are only 3 games below .500 is a testament to their pitching especially relief pitching. Their ability to score runs has been near or at the bottom of the league across the board. The only season close to this season was 2019.  All data below is through May 10th since 2015.

(RISP = Runners in scoring position)


Cleveland Guardians record as of May 11th:  (thru 37 games)

2023:  17 -20

2022:   17 - 20

2021:   21 -16

2019:   20 - 17

2018:   18 - 19

2017:    20 -17

2016:    20 - 17

2015:    14 - 23

Tuesday, April 25, 2023

When Will This Cool/Unsettled Pattern Change?


It's not uncommon for April to feature stalled low pressure with long stretches of "cool" air across the Great Lakes/New England.  Our long stretch of warmth a few weeks ago makes this cooler/cloudy/rainy pattern that much harder to deal with.  What does the long range (2-3 week outlook) say?

The southern oscillation index went through some significant changes over the last week and a half. The greater these day-to-day changes the stronger the effect across North America, Here is the peer reviewed research:  PAPER HERE


SOI analog forecast show the Great Lakes/Eastern US trough backing off by mid month.  How quickly will the Southeast ridge build back is the big question.


Another element going forward this summer and fall will be the building El Nino. I'm not going to go into the specifics of that here. Perhaps a blog post on this in the weeks and months ahead. But as La Nina decays, the overall effects will be cascading across the Pacific augmenting the jet stream and the weather across North America.

Watch the decaying La Nina as shown through the weekly sea surface temperature anomalies from December 2022 to mid April 2023:  Watch the blue area disappear slowly.

Sea Surface Temperature Anomalies

The big drivers of the pattern change have been the ridge of high pressure in the Gulf of Alaska and the western corners of North America along, the deep low pressure over the Aleutian islands and the stalled ridge over Greenland (negative North Atlantic Oscillation). The position of these high pressure ridges have allowed low pressure to undercut them through the middle of the US. This has significantly suppressed the Bermuda high which brought us the warmth a couple weeks ago locking in below normal temperatures across the eastern 2/3 of the US.

Based upon all of these factors, I don't foresee any long stretches over warmth across the Great lakes and Ohio valley through at least the middle of May.  


The reinforcing front Sunday/Monday of next week could produce rain/snow mix.  Here was my forecast tweet from April 20 on the early May rain/snow mix potential.


As of this writing (April 25) the new EURO and GFS models show the Greenland Ridge & western North America ridge (red areas) holding strong until the second week of May then gradual weakening. This flattens the trough across the central US bringing an end to the unsettled pattern. These solutions were indicated on the SOI analogs more than a week ago.


Temperatures per the GFS also corroborate what the SOI analogs indicated 2 weeks ago.  That is gradual improvement across the central US and Ohio Valley but still no big signs of any long stretches of warmth.


Monday, April 17, 2023

What's Driving The Big Temperature Changes?

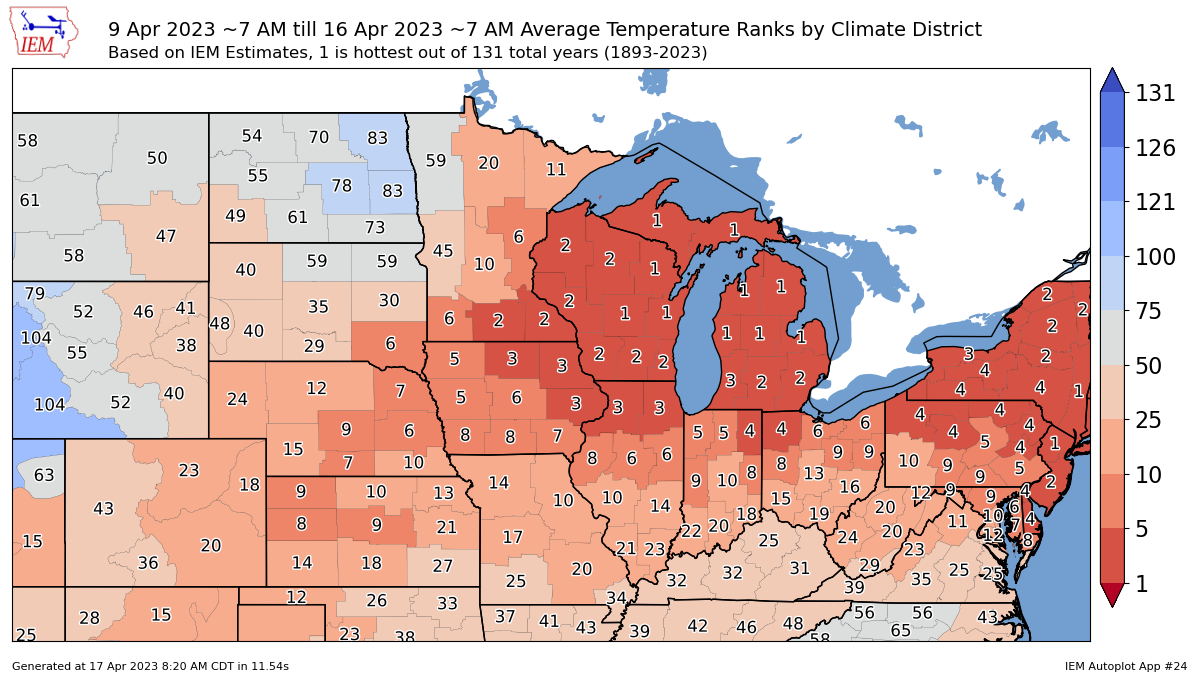
We just came off of the warmest seven day period since the middle of last September. 

64, 74, 80, 82, 82, 80, 79

Winning lotto numbers...not bad considering is occurred between April 10 and the 17th.  Look at these temperature ranking during the period. 


We came off of a highly variable March. No long stretches of warmth. A nine day stretch with below normal temps in the middle of the month. 


Why the pattern become consistently warmer?

The answer lies in the MJO (Madden Julian Oscillation). We need to look at the tropical Pacific. 

The MJO (read about it here) moves in varying magnitudes from west to east along the equator.  Here is a nice animation.  Green is more cloud cover. Brown colors are less cloud cover.  Notice how the northern Pacific jet stream fluctuates as the MJO moves through different phases (1 to 8).


Here is cross section of what is occurring.


How does something that is on the other side of the earth impact our weather?

Notice the temperatures in early March when the MJO was in a super-strong phase 8-1, slightly warmer than normal than it moved into a cooler phase (2 & 3) which connects with the cooler than normal mid March.  MJO then spun back around to phase 7-8-1 (lower magnitude) which connected to the 70s and 80s we had last week. The MJO impacts are different depending on the season.  You'll notice the MJO in similar phases (April 17 to 30 forecast but weaker) to early the March phase (stronger).  This looks to connect with a cooler next 7-10 days across the eastern 2/3 of the US.


There are always many drivers at work impacting the weather pattern. The MJO was just one of many influencing our weather with summer like temperatures last week.