Showing posts with label snow. Show all posts

Monday, January 22, 2024

Snow Totals From Last Week's Storm?

Snow started early Friday morning and ended late Saturday evening/night.


Here are the individual totals for each region of northern Ohio:


Seasonal Snow Totals Through January 22 - Last 10 Winters:


Comparison between last winter and this winter through January 22 across northern Ohio.


Monday, March 20, 2023

If the rain this winter was snow how much would we have?

It's a great question.  

After all actual snowfall this winter versus the 20 or 30 year averages was extremely low.  
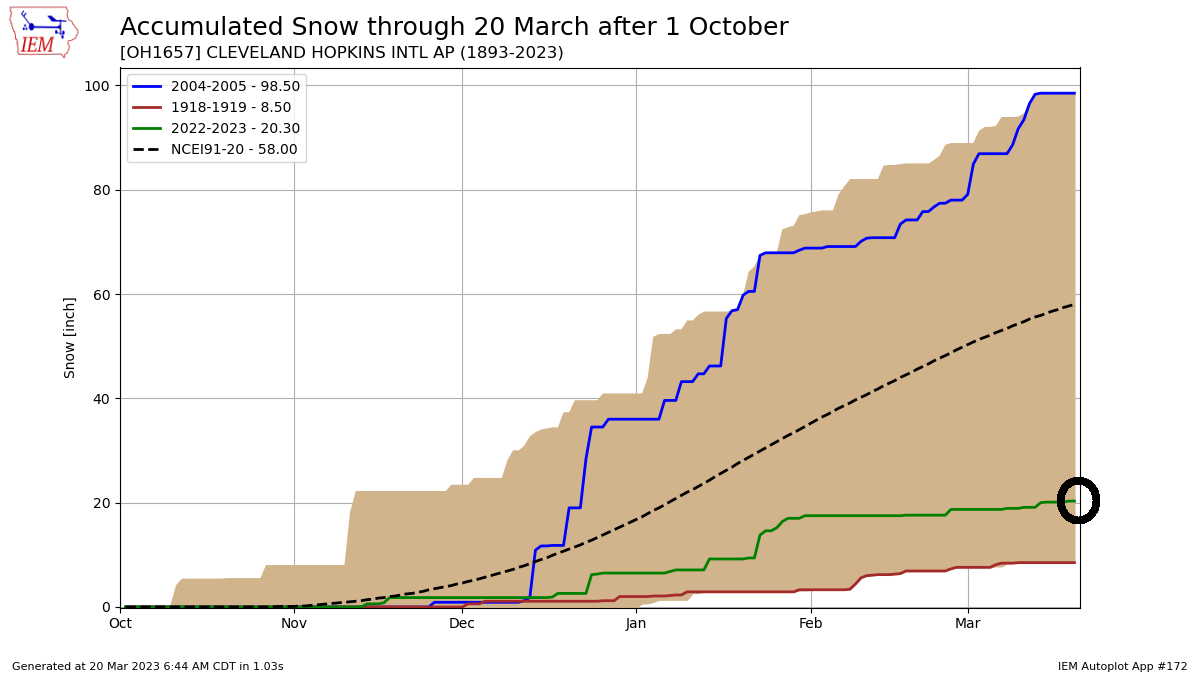

Snowfall as of this writing in Cleveland is barely above 20 inches.  Yet the liquid precipitation (rain and snow combined) is north of 12 inches!


Before we attempt to answer this let's recap the winter storm track. After one of the warmest winters on record here in northern Ohio and across a large portion of the Great Lakes and Ohio valley, storm systems coming out of Texas ended up producing more rain on the southern end of the track with heavy snow staying across the northern states. Total precipitation (rain and snow) was well above normal in areas that saw above normal snowfall vs areas that saw more rain than snow.


Total precipitation from November through December was well below normal. January through mid March total precipitation was well above normal.


So how much snow would all of this precipitation give us if we converted ALL of it to snow?  

Converting liquid precipitation to snow using a (15" of snow to 1" liquid ratio) would give us these numbers (orange) vs actual snowfall (blue).  15 to 1 ratio is arbitrary as wetter snow would closer to 10 to 1 and super-dry snow could be as high as 25 to 1.  I took the middle ground.  The higher the orange line, the more total precipitation thus more potential snow (if converted).


Next we need to find the difference between the actual snowfall (blue above) each winter from the total converted liquid to snowfall (orange) to give us the remaining potential snow.  The larger the difference, the more liquid precipitation (converted to snow) that winter. I plotted each year's difference in the bar graph below.  


The top 10 highlighted below with 2022-23 highlighted for reference.
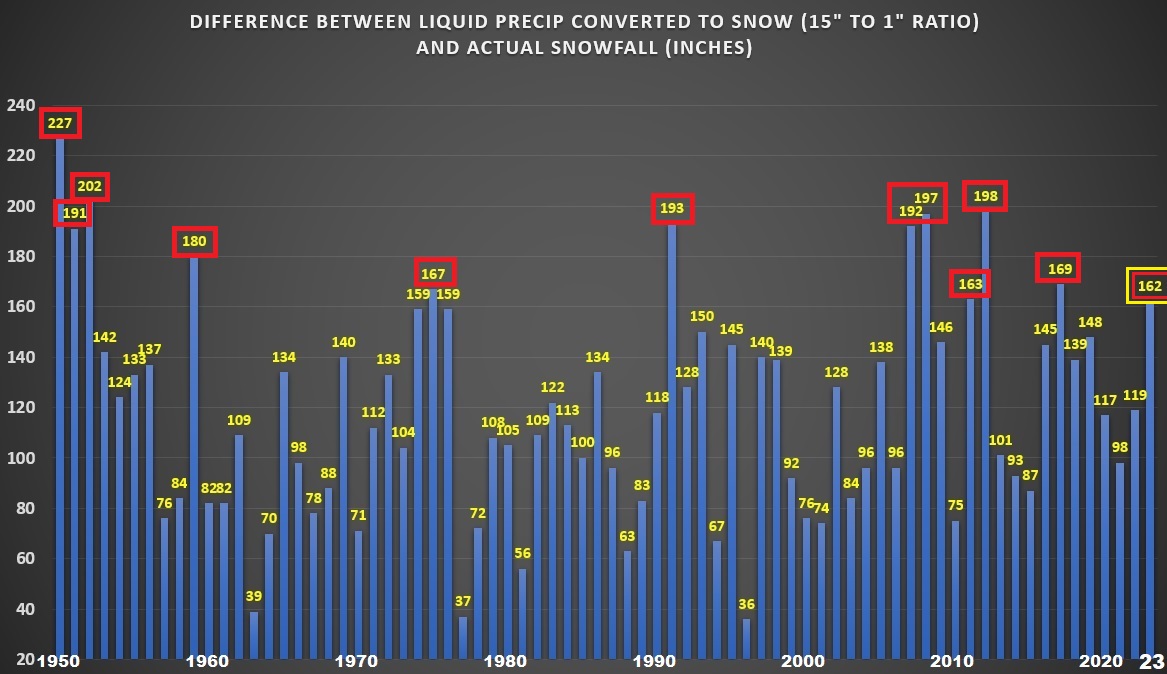

Bottom line is that the winter liquid precipitation (after subtracting the actual snowfall) this winter when converted to potential snow yielded a number just outside the top 10 highest since 1950 (graphic above). This winter had the highest liquid to potential snow since the winter of 2017-18 and a 36% increase comparing this winter to last winter and 65% increase compared to two winters ago. Yet this winter didn't crack the top of the list but its up there. 

1949-50:  227"

1951-52:  202"

2011-12:  198"

2007-08:  197"

1990-91:  193"

2006-07:  192"

1950-51:  191"  

1958-59:  180"

2016-17:  169"

1974-75:  167"

2010-11:  163"

2022-23:  162"

Wednesday, November 25, 2020

History of Snow Between Thanksgiving and Christmas: Are Our Chances Higher This Year?

In late October, we issued our WINTER WEATHER OUTLOOK for 2020-2021.  The general idea is for a backloaded winter with shorter "teaser" periods of cold and snow in December.  So far (as of this writing before Thanksgiving, we've had under an inch of snow). 

Sledding with my kids when they were much younger!

How much snow do we typically get between Thanksgiving and New Years' Eve? We average around 10" over the last 10 years although the trend for early season snow has dropped over the last 15 years.

How about actual snowfalls?  We average around 4 one-inch snowfalls during the holidays.


Snowfall is one thing. But snow on the ground during the holidays is entirely different. More days with snow on the ground, the better chance we will remember it as a "snowy" holiday. We average around 8 days with snow on the ground over the last 10-15 years. 


As of this writing we are watching for changes in the pattern that strongly show more cold.

* Ridge developing across central Asia
* Jet stream across the North Pacific changing
* More frequent lows across Northern Pacific

All of this is resulting in the high pressure across the western US/North America with low pressure across eastern US. We call this a +PNA pattern (Pacific North American)


The super-long range model output into Christmas week is also strongly hinting at this eastern TROUGH/COLD lasting beyond December 20th. While I think this is probable, my confidence is high ONLY through the first two weeks of the month.

Animation from Thanksgiving to December 21st

Historically we average 15 days with temperatures in the 30s or COLDER over the last 10-15 years. Last winter we had 14 days in the 30s or COLDER before December 31st


Either way, cold and BELOW NORMAL temperatures are coming the first week of December with good chances of accumulating snow along with lake effect multiple times! Winter is coming everyone...


Friday, July 15, 2016

Preliminary WINTER 2016-17 Outlook

My HIGHLY Preliminary WINTER 2016-17 outlook showing the average temperatures for DECEMBER THROUGH FEBRUARY.  Yes it's early and no, its not too late to gather the pieces. This is will be revised later this summer and again in the fall.


It is looking more likely that a weak La Nina (this post back in early June describes La Nina) will be the driver from the tropics this upcoming winter. Last winter, we had a very strong El Nino.

Take a close look at the snowfall numbers vs the 30 year average for these LA NINA years. I put this graphic together in early June.  HINT...HINT!

Again, all of this is HIGHLY PRELIMINARY and will need to be updated in the fall. This is why no specifics are indicated just general thoughts.

Snowfall departures below are snowfall amounts vs the 30 year average in past La Nina winters


Friday, January 08, 2016

Winter Pattern Taking Shape

Back in September, I strongly speculated on the possible winter pattern. This was my initial outlook given the initial conditions and projections FOR DECEMBER back in September.  In reality, the southern jet stream hadn't established itself as a winter storm driver.


The position of the warmth was too far west for December.  The arctic air over the North Pole was very stable. The ridge was powerful across the east. Heavy rain and severe storms/deadly tornadoes during the month were common around Christmas.
On December 6th, I opined using videos (bottom half of the post at this link) showing the stronger position and intensity of the southern jet stream in January.

Our final winter outlook in late October echoed this southern panhandle storm track for the second half of winter


The extended models are this southern storm track (panhandle lows) as the dominant track through much of February.  Here are the snapshots on six periods of seven days each ending during the third week of February.


Most of the teleconnections (NAO, AO and PNA--EPO bouncing back a bit) showing troughiness in the east overall.


All of these factors seem to be the real deal which will lead to colder temperatures and higher chances of panhandle low type systems to interact with colder air leading to an eastward push of snow!

Lake Erie ice cover is nearly non-existent. Last year (before the record setting cold developed) ice cover was only 5% through the first 8 days of January. The current water temperature is still at 40 degrees.  The average water temperature is 35 on the 8th. Any cold outbreak like what we will see next week will aid in dropping the water temperature versus adding lake ice outside of the western basin where the water depth is shallow. Bottom line, lake effect snow is more possible January through March than in past years.


Wednesday, December 23, 2015

Let's Clear Up A Few Things...

Many wonder why I write so much about the psychology of weather. If you read the comments on most of my posts over the last several weeks you'll see why: They believe what they want to believe. They use social media as a conduit to say whatever impulsive thought they want without recourse. Perception is the ultimate reality.

I use social media and my blog to show why weather events occur the way they do. I post stats and records about past weather to show some perspective in the hope that this will help viewers of our station and the general reader. Often times it just doesn't work...much to my dismay.

So let's clear up a few things. Rather than use science to explain the why we do what we do, I'm using straight forward bullet points. Let's wipe the slate clean and start out fresh and new as we approach the end of the year.

*******************

1) It WILL snow at some point. It always does. And no, I don't like snow.

2) The warm weather is playing with our minds.  Our weather perceptions (cognitive biases if you will) are very strong.  We are not immune.  We are all human.  Recognition of these preconceived notions is the first step in an objective understanding the weather and the science that governs it.

2a)  We hate forecast uncertainty. Here's why LINK

3) Contrary to what you might believe, weather forecasts are more accurate than they were 15 years ago.  According to this study, "the accuracy of the 8-10 day forecast today are similar to a 5-7 day forecast 15 years ago. Hurricane accuracy is greatly improved since Hurricane Katrina LINK.

4) Our morning show here at FOX 8 is on for 6 hours. The weather forecast between 4 and 10am can change as the conditions change. Forecasts are not frozen in time during each newscast.  The weather doesn't stop for television.

5) The decision to break into a popular TV show or sporting event with a weather update is NOT an impulsive one. Stations have different philosophies on when to break into programming. I can't speak for the others. However, my station WJW-FOX 8 only breaks during a tornado warning or a significant winter weather event (widespread, blizzard-like snow). If you send a comment complaining about our stringent guidelines, you obviously care more about football than being warned when a tornado warning is issued.

6) Contrary to many weather maps on the air, the atmosphere is three dimensional and ever changing. Imagine the atmosphere (especially during sleet, freezing rain events) like layers of a wedding cake.  Each layer of icing represents the different layers of air at different temperatures with different types of precipitation.

Note: The wedding cake analogy is mine and mine alone. I invented it.

7) Moon or sun halos are not uncommon. They are beautiful sights caused by the bending, splitting and reflecting of sunlight through ice crystal clouds.  We have hundreds of photos.

8) I'm not a fan of phone weather apps that promise super-local weather forecasts for your backyard. They are like unicorns.  They don't exist.  Most are computer generated data approximated based on your location via GPS.  I trust a human generated forecast (via NWS or your local tv station) every day of the week.

9) Jet contrails are not chem-trails.  They, like, unicorns don't exist.  I don't like conspiracy theories.

10) I have no control of weather, news or school closing promos that run 15 times per hour. The promotions department is on the first floor.

11) These above normal December temperatures were mentioned in a blog post on my weather blog in early September and again in our FOX 8 winter weather outlook. Yes, pre-Christmas warmth has happened before.  Remember 1982?


12) Simply because the weather has been warm or cold, wet or dry doesn't confirm or deny climate change in any form. I'm an operational meteorologist who happens to be on television.  Keep your subjectivity or bias to yourself.  So please don't send me anecdotal evidence confirming your preconceived notions.  See number 2 above for the reasons why.

13) We forget that last December was above normal with no snow for only the 3rd time in 140 years.  Christmas week in 2014 was the 8th warmest on record in northern Ohio.

14) This warmth is driven by BOTH El Nino and a strong Polar Vortex not just El Nino. Remember the Polar Vortex from last winter?  Yes, it's real (LINK)

15) Storm systems like what we are seeing currently which develop over Texas and move northeast--termed "Panhandle Hooks"--are more common in El Ninos.  Wet snows are more common from Texas through the mid-Atlantic in these years.

16) Contrary to what we believe, you cannot use one or two days or a weeks worth of weather as a predictor or the season ahead. In other words, a warm or cold December is not an indicator of the spring or summer ahead. The drivers of winter aren't necessarily the drivers of spring and summer.  It's not an apples to apples comparison.  (Remember December 2014 was warmer than normal.  Then the bottom fell out: January through February was the 6th coldest on record, coldest since 1978)

17) The fact that I have said over the last week that colder air in January will replace the relative warmth in December doesn't mean the entire winter will be colder than average. (see FOX 8 outlook issued in October)

18) Lake Erie water temperature is 45 degrees. It's been this warm before on the 22nd of December: 2001 and 1998 for starters.  The water temperature is taken at a depth of 30 feet. No one seems to have an answer as to why.

19) There is a TON of science behind seasonal outlooks. The Farmers' Almanac is not science (although I enjoy reading it).  Weather consulting companies issue seasonal outlooks tailored for their clients. This sector has grown significantly in recent years.

20) Many readers will ignore everything I typed here and replace it with their own conclusions regardless of their validity.

I reserve the right to add to this list.

I hope this helps.